
MA: Mastercard (2)
Preface
We have written in much more detail about MA here. During then, MA market cap was $523b and we deemed the stock was too expensive, although it’s obviously a wonderful business.
A few months later, the market cap is at $446b and we think it’s getting to fairly priced territory.
Toll Bridge
The status quo in payments rests with Visa & Mastercard (V/MA). This has persisted for a long time and we think that it will continue.
The payment experience is extremely secure, convenient and rewarding for consumers. Issuance and acceptance are ubiquitous. Despite merchants complaining about fees, the existence of V/MA have benefits that outweigh costs.
This sets a high bar for an alternative system to clear, which would take significant time and money to replicate on a global scale.
If a legitimate competitor exists, what is its motivation for creating an alternative system?
It has to be reduced costs for merchants.
But wouldn’t a competitor demand adequate compensation for achieving parity with the current system that works so well for all participants?
Much of the debate in payments today centers on ecosystem players. There are so many of them: Adyen, Stripe, Shopify, Toast, Apple Pay, PayPal, SoFi, Venmo etc. Every one of them compete in their own markets, but the question of who will win is irrelevant to V/MA.
Why?
Because all roads lead to V/MA.
The business is like a toll bridge. Whenever payment data goes through the payment rails, they extract a small percentage fee. Regardless of how many payment competitors, they all link up with V/MA in some way or another.
The toll bridge shows up in net revenue growth over time, except for one-off 2020 COVID pandemic, the historical growth rates have been remarkably stable at over 10%. What’s remarkable is the quick rebound as physical commerce was replaced by online transactions. By 2021, despite the lack of higher net revenue cross-border transactions, overall growth rates have returned to normal.
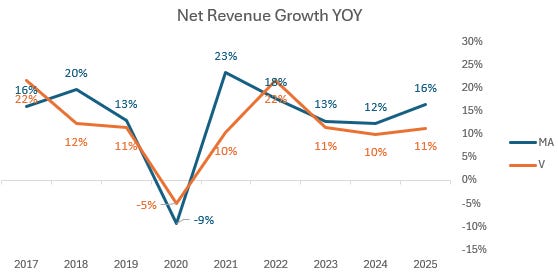
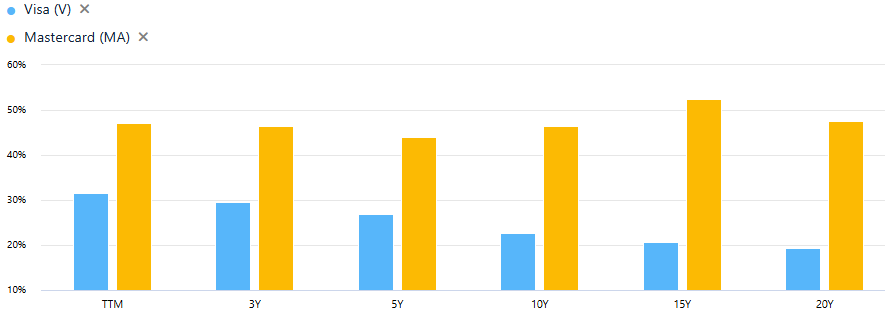
This is even more impressive when we see their long term ROIC. Competitors just cannot displace the duopoly:
The underlying foundation for this growth is the massive total addressable market (TAM).
Both companies in their investor presentation slides presented a $21—23t unaddressed opportunity in consumer payments (excluding China), and a lightly penetrated $100—200t total opportunity in new flows, including commercial payments and money movement.
V/MA still has a long runway especially in developing countries where most people are still using cash.
Net Revenue Yields
If we divide net revenues by payment volumes, we get net revenue yields. This metric shows whether V/MA have pricing power or not.
While V/MA have seen their net revenue yields increase over the past decade, suggesting a degree of pricing power and value creation, MA yields have increased faster:
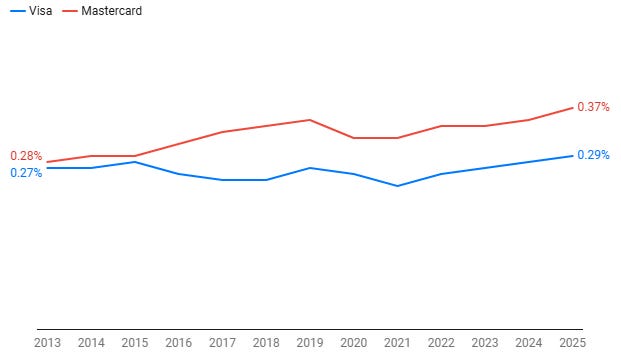
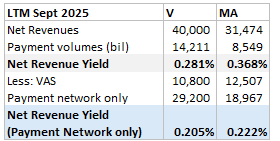
This is attributable to MA growing mix of value-added services (VAS) revenue but also reflects Visa’s acquisition of Visa Europe in 2016, which had a lower yield. If we exclude VAS revenue for both, the spread narrows:
Operating Margins
Both V/MA have admirable margins due to their capital-light nature. Visa is more profitable because it gives less customers incentives as a proportion of revenues. Note: 2025 Visa had $2.5b of litigation expenses, if excluded op margins are 65%.
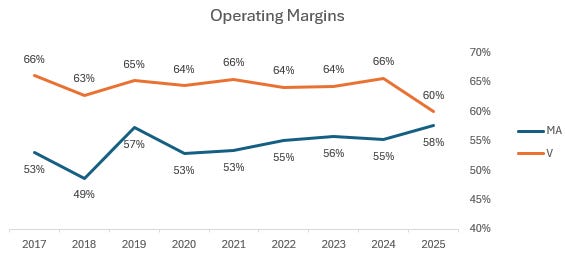
This shows that the duopoly has rational pricing despite being the targets of merchant lobbying and regulation.
Love Hate Relationship with Merchants
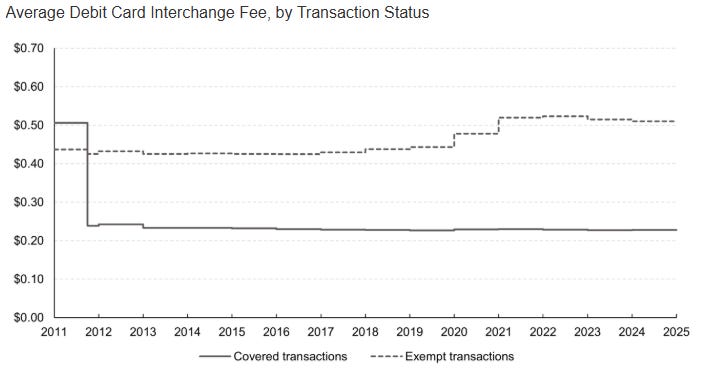
Merchants and payment networks have been fighting over interchange fees since the beginning of time. Merchants have managed to influence regulators to lower interchange fees. For example:
Debit card interchange in the US (Durbin Amendment, 2010):

Credit Card Competition Act (CCCA), which would require merchants to have at least two unaffiliated network options for processing credit card transactions.
In Australia, the central bank is proposing a further reduction of its cap on debit and credit card interchange rates while eliminating surcharging.
If interchange fees are lowered enough, it will make it less appealing for banks to issue cards, extend credit and offer rewards, all of that will slow payment volume growth.
But payment volumes for V/MA are still growing nicely. Why?
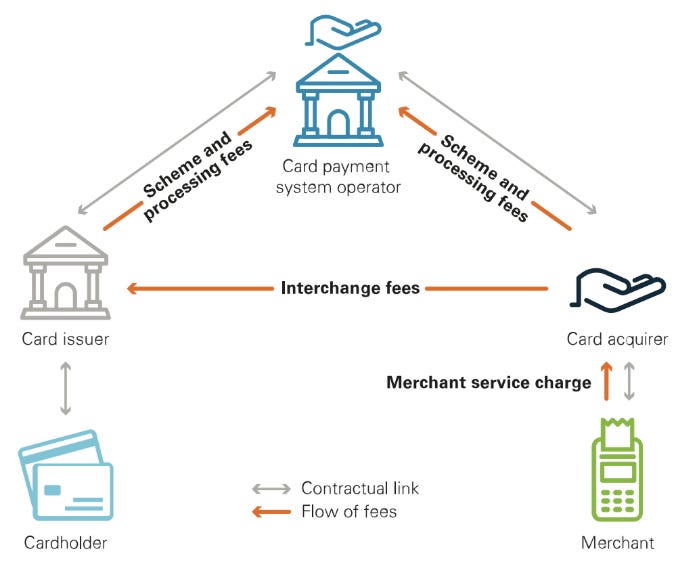
To maintain volumes, V/MA can simply increase processing fees from merchants, who benefit from lower interchange fees. Then on the other side, they reduce processing fees for issuers, who are hurt by lower interchange fees. This balancing act ensures that issuers and merchants are both incentivized to use V/MA.
Then we have the problem of surcharging. In the US, merchants can surcharge up to 4% of a credit card transaction’s value. However, surcharging is not allowed for debit card transactions. This can incentivize consumers to shift to debit cards, which are less profitable for V/MA.
However, there’s also a cost for merchants who impose surcharges, the customer can simply shop elsewhere. V/MA is incredibly convenient, and so it is unlikely that a significant number of merchants will surcharge credit cards. Furthermore, credit cards have rewards that consumers won’t want to give up, so putting a surcharge is likely to reduce the merchant’s business.
BNPL (Buy Now Pay Later)
BNPL is effectively a loan. It offers consumers, especially those with less ideal credit history, the opportunity to purchase an item and pay for it over time, usually incurring little or no interest charges.
For the merchant, BNPL offers a way to attract new customers and increase order values and conversion. Credit performance has been good so far, and many believe the shorter duration of these loans will allow issuers to adapt in to changing conditions, decreasing the likelihood of large credit losses during a recession.
However, most BNPL loans are repaid with debit or credit cards, so the transaction volume didn’t entire escape V/MA. Merchants also have to pay more fees for BNPL schemes relative to a standard credit card transaction.
In fact, the largest BNPL providers are Affirm and Klarna, both of them support Visa.
American Express (AMEX)
Visa shows comparison between other payment rails. AMEX is the most able competitor in the important affluent category.
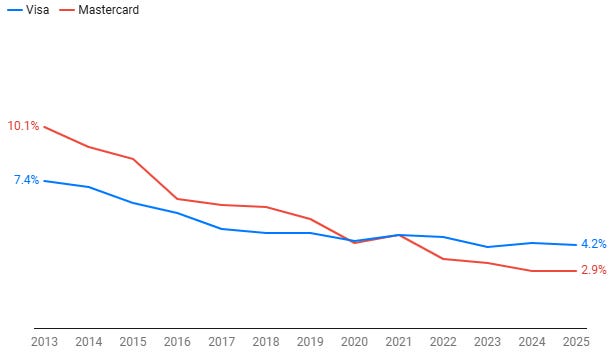
The only solution is for V/MA to continue reinvesting into technology, acceptance and global interoperability. With economies of scale, the operating leverage that V/MA have is quite significant. We can see evidence in the marketing expense as a % of net revenues over time:
Stablecoins
Historically, stablecoins acted as an intermediary for converting crypto to fiat (crypto to stablecoin, then to fiat), but with passage of the GENIUS Act, which provides a regulatory framework for stablecoins, new use cases are gaining legitimacy, including cross-border payments.
Some people think that stablecoin payments will reduce the need for V/MA networks. But this questionable, because stablecoins are designed to replicate US dollar-based accounts, which consumers already have access to. Whichever method an issuer is using, they are likely to demand interchange fees from merchants to compensate for credit risk.
We don’t think stablecoin lowers the friction that a consumer faces when making payment. Even if stablecoins are truly low friction, then the entity orchestrating this network would demand adequate compensation — this will prevent a complete disintermediation of V/MA.
A possible outcome is that stablecoins take a portion of cross border payments. These are expensive transactions that give V/MA higher net revenue yields. Such a case can indeed negatively impact V/MA.
Real-Time Payments (RTP)
RTP offers near-instantaneous movement and settlement of funds between bank accounts, and serve use cases including person-to-person transfers, disbursements, and consumer payments.
According to Visa, RTP networks have launched in at least 80 countries, including FedNow in the US during 2023. Among the most successful RTP networks are PIX in Brazil, and United Payments Interface (UPI) in India. Both enjoy strong support from their central banks, and have grown consumer-to-business payment volumes significantly during their short existence.
The good news is that these countries are large and developing economies with enough growth to share. Even though V/MA compete directly with RTP on transactions, they do also provide value-added services.
Mastercard or Visa?
We think MA has a higher structural growth profile than Visa in the short run. There are 2 reasons:
MA has proportionally more VAS revenues. Do note that VAS probably carries lower margins than network payments. We can see this in MA larger employee headcount and higher payroll expenses. But we also think that VAS is a form of diversification to protect profits in a recession when volumes fall. VAS is now the fastest-growing and strategically most important segment for MA.
In Q1 2026, MA reported $2.8b VAS revenues and grew at +18%, nearly twice the rate of the core payment network. Key drivers included security solutions (Recorded Future reached 500+ enterprise customers within 12 months of launch), Ethoca fraud intelligence (+25% YOY), authentication services, business & market insights, consumer acquisition & engagement services. This mix shift toward VAS is a positive development.MA has higher Rest of World (ROW) exposure. ROW countries grow faster than the US and MA generates 68% of revenues (debit & credit) from them. For comparison, since Q4 2017 after Visa acquired Visa Europe, its ROW volumes went from $999b to $1955b (+95%). MA grew much faster from $566b to $1528b (+170%).
Valuation
We do a reverse DCF to find the return we can expect, and the growth assumptions baked into today’s $505 share price:
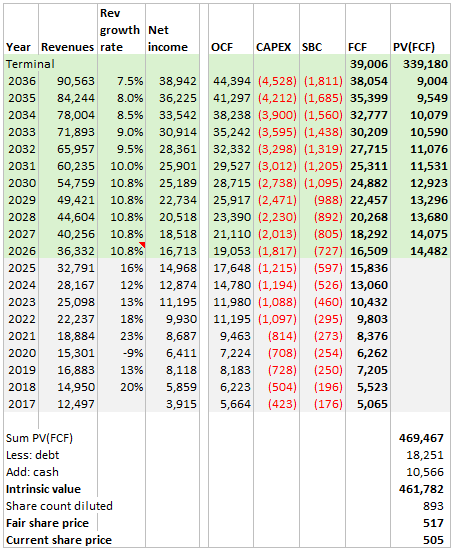
The terminal value has an implied FCF exit multiple of 9x.
Main assumptions are:
Revenue growth for first 5 years at 10.8%. Proportion: VAS 40%, payment network 60%. Growth rates: VAS +15%, Payment network +8%.
FCF margin broadly same as historical.
Terminal growth = 2.5%
Solving for today’s price, the discount rate (expected return) is 14%.
Notes on Relative Valuation
It is highly likely that over the next couple of years that MA will be able to grow faster than Visa, but take caution when assigning a premium on MA shares simply due to this fact.
Here are some reasons why Visa could beat MA in VAS over the long run:
Visa is simply bigger at 60% of global card volumes, compared to MA 30%. VAS potential is proportionate to the size of the network. Because Visa has double the volumes, its potential for selling security and data services is inherently twice as large.
Visa has been more aggressive in expanding the endpoints (bank accounts, digital wallets, cards…) where its services can reach. Visa Direct reaches 12 billion endpoints, while Mastercard Move only reaches 10 billion endpoints. Most of Visa’s endpoints come from companies in developed countries where banks and merchants operate in highly competitive markets. A small improvement in conversion/churn is worth a lot of money, this increases the willingness to pay for VAS solutions.
Developed market endpoints generate richer data because of higher average transaction values and more diverse merchant categories. Visa’s Gemini-integrated AI models learn faster on high-velocity data. This creates a flywheel effect; better data from developed endpoints will lead to better VAS products.
All this is to say that when comparing relative valuations between Visa and MA, we should focus on the TAM and growth durability over the long run.
Purchasing MA at a higher valuation than Visa does not make sense, as the key driver of future returns in the business comes from the VAS segment and not the payment network, which has arguably saturated the TAM and is unlikely to grow faster than steady state.