
MA: Mastercard (1)
Preface
We wrote about a study on payment networks here exploring the economics of various cashless payment modes, and why Visa & Mastercard are very strong businesses.
This post is a business breakdown of MA.
History
The company that would become Mastercard Inc. was conceived in 1966 when a consortium of banks met in Buffalo, New York.
Karl H. Hinke, a vice president at Marine Midland Bank, invited the banks to discuss banding together to offer credit card services. It was a sound idea spurred by reports regarding the strong growth of Bank of America’s BankAmericard, which would eventually become Visa. The Buffalo meeting established the Interbank Card Association (ICA). Within a year, the ICA had 150 members, and Hinke was named chairman.
National branding was an issue at the concept’s beginning because each issuing bank had a say in its card design. In 1969, the ICA unveiled Master Charge: The Interbank Card, with a logo of overlapping orange and yellow circles.
Also, in 1969, First National City Bank (now Citibank) added its Everything Card to the Master Charge family, expanding Master Charge’s national reach. A decade later, Master Charge was renamed to Mastercard.
Overseas Expansion
The ICA expanded outside the US in 1968 by partnering with Eurocard. This gave the ICA inroads into the European market and equally benefited Eurocard, which gained access to the ICA network. That same year, the ICA allied with Mexico’s Banco Nacional and a handful of institutions in Japan.
The UK’s popular Access card joined the consortium in 1972; many years later it was acquired by Mastercard in 1997. The ICA continued to expand internationally, and in the late 1970s, renamed itself to Mastercard International.
In the 1980s, Mastercard made entry into Asia and South America. It also became the first payment card issuer in China.
Further international expansion occurred in 2002 when Mastercard International merged with credit card issuer Europay International, which had assumed Eurocard a decade earlier. Mastercard International rebranded to Mastercard Worldwide in 2006 and adopted a new logo. In this same year, Mastercard was listed on the NYSE.
In 2010, Ajay Banga became the CEO and shifted Mastercard from a credit card business to a payment technology giant. He would step down at the end of 2020 and Michael Miebach took over.
Cryptocurrencies
Under the leadership of Michael Miebach, Mastercard began to lean more heavily into the digital world.
In February 2021, Mastercard jumped on the cryptocurrency bandwagon, announcing that it would soon support certain cryptocurrencies and allow them to be used for payments.
In October 2021, the company established a partnership with Bakkt (crypto firm spun off by Intercontinental Exchange) that would allow any member bank or merchant to offer cryptocurrency services.
The next year, Mastercard partnered with Paxos, a cryptocurrency trading system, to establish Crypto Source, a program allowing member financial institutions to provide cryptocurrency trading to their clients.
Payment Ecosystem
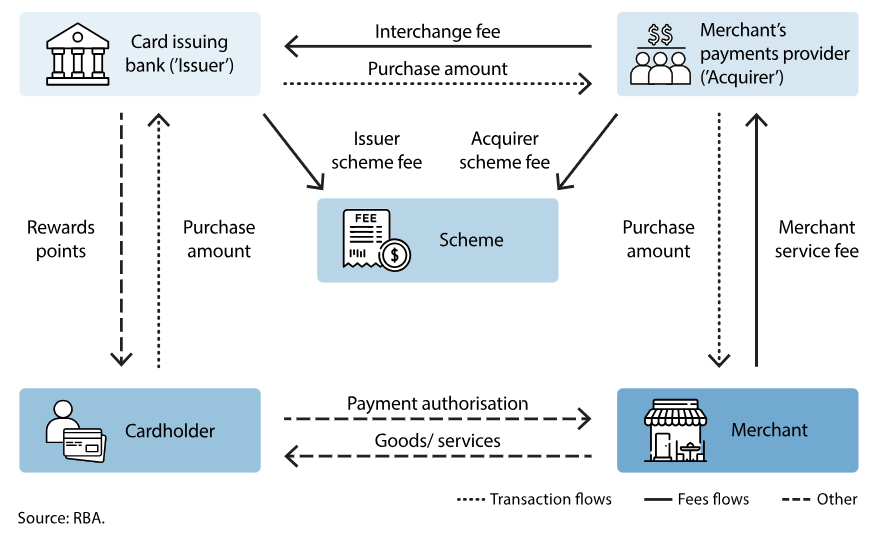
The payments ecosystem is complex and consists of multiple parties with varying fee arrangements. The ecosystem is referred to as a “four-party” network and includes the following players:
Issuer: mainly banks and FinTechs who issue cards to account holders.
Account holder: a person/entity who holds a card that can be used for payments.
Merchant: the place where an account holder makes a purchase.
Acquirer: the financial institution of the merchant (eg. Adyen, Paypal)
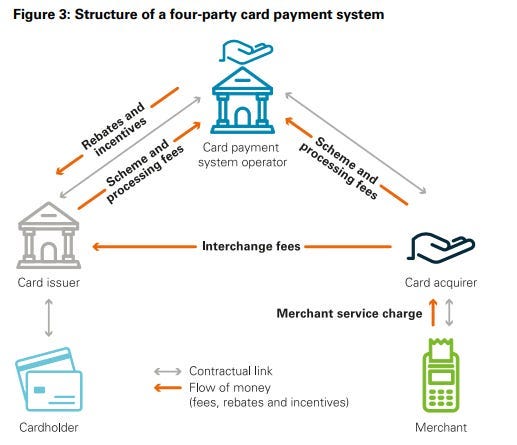
Four-party card schemes like MA and Visa are two-sided networks. They serve issuers/cardholders on the issuing side and acquirers/merchants on the acquiring side. For the card payment system to function, it requires participation of both sides of the network.
On the acquiring side, merchants must be willing to accept cards from the scheme; on the issuing side, issuers need to be convinced to issue the scheme’s cards to their customers. These cardholders then must be incentivized to use their cards when making payments.
So the first important point: MA does not issue credit/debit cards. They also don’t do payment terminals. What they offer is the payment network that ensures money goss from the cardholder to merchant efficiently and securely.
Payment Economics
The flowchart below illustrates:
The merchant is ultimately the one bearing the cost that funds the acquirers, issuers, and card schemes.
The total charge usually ranges from 1-3%. In return, merchants get access to a digital method of payment that increases volumes and reduces the cost of managing cash.
MA (and other card schemes) receive the smallest portion of the transaction ~10%. Interchange fees are also not significant. The majority of economics flow to acquirers, who bear the cost of processing the transaction and the risk of the transaction. It is also an area that has seen less regulation.
The economics of MA looks like this:
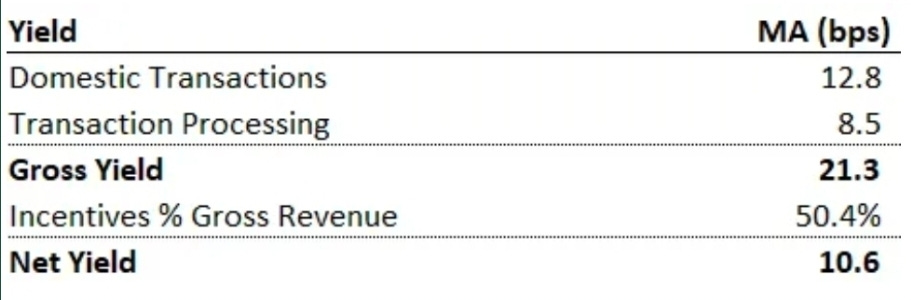
For every $100 domestic transaction, MA receives a gross amount of $0.21, but has to return 50% as incentives and ends up netting $0.11. The actual net amount is likely lower given incentives are concentrated to domestic transactions.
The card networks only take a small percentage of the transaction fee, while acquirers take the largest portion.
Payment Network
Payment Network generated $17.3b revenues and has the largest share of 61% in 2024. We can further split into:
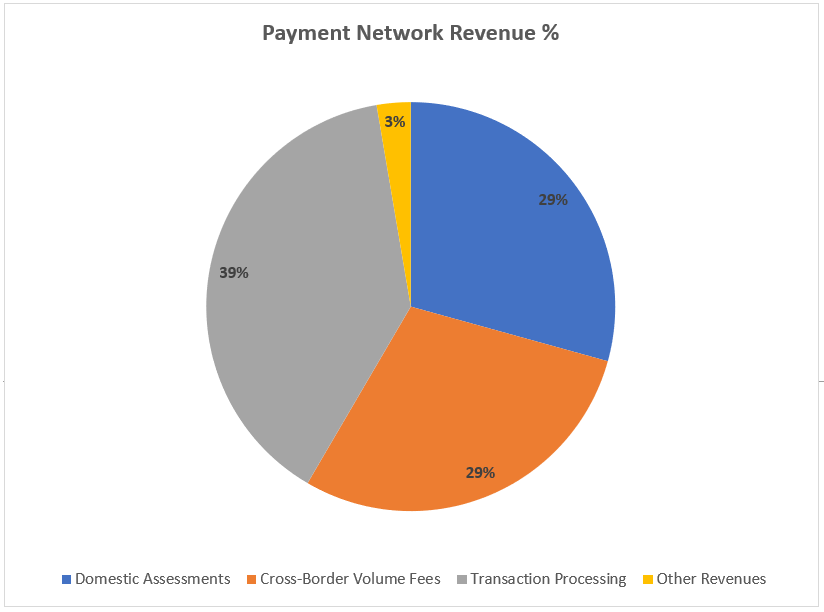
Transaction Processing
Revenue comes from the volume of “switched transactions” processed through MA network.
Switched transactions are when MA systems authorise, clear and settle the flow of money. The percentage of switched transactions has remained stable since 2012.
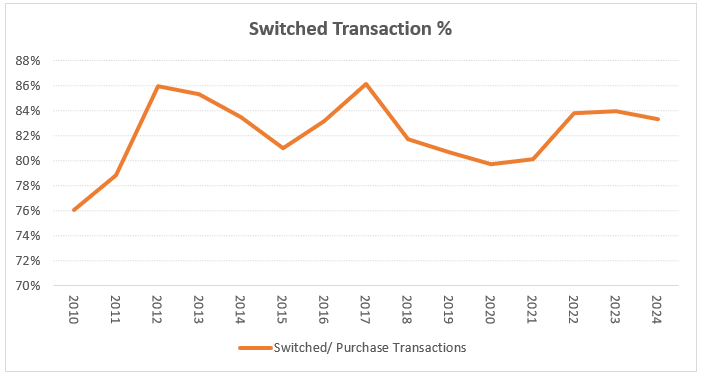
Switched transactions grew +13% CAGR for the past 5 years. People are using cards more often and in smaller increments such as tapping in trains or convenience stores. Highly penetrated card regions show that having widespread acceptance locations drives more usage as consumers build greater trust and recurring habits.
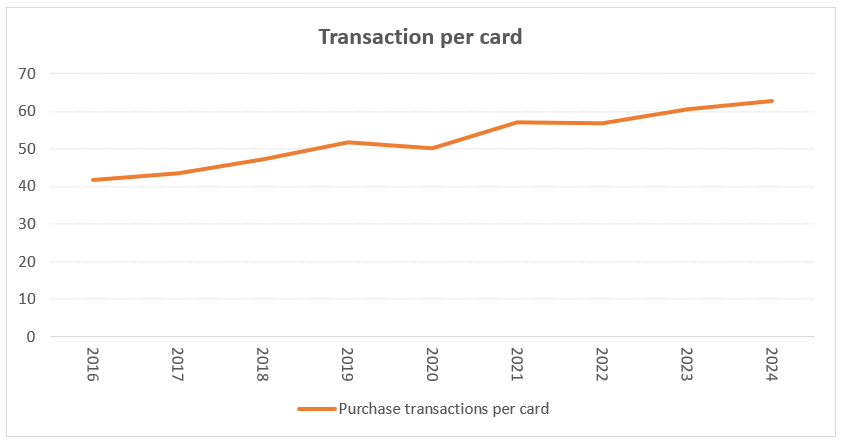
MA average transactions per card is 60 per year. This number is very low because under-penetrated countries are still on physical cash.
MA takes ~8.5bps per transaction, this has been stable for some time despite growth in cross-border transactions, implying domestic fee pressures:
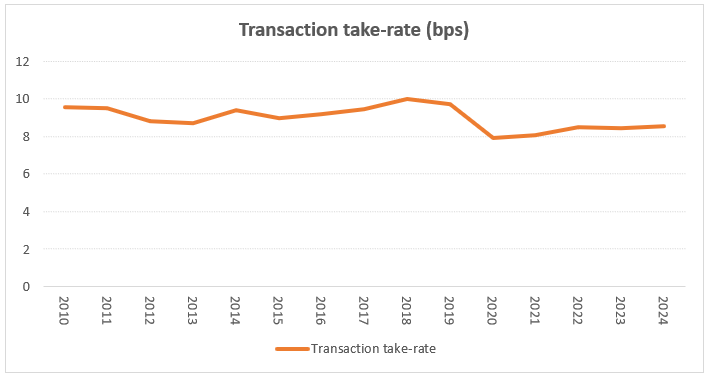
A stable take-rate with growing transaction frequency implies a long runway for MA.
Domestic Assessments
This segment is for domestic spending using MA cards.
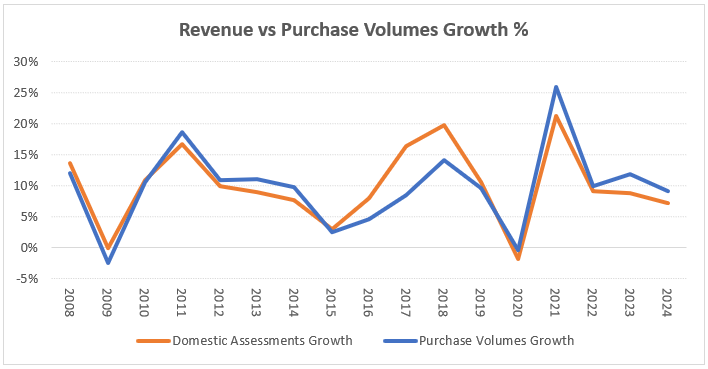
Revenue increases as cardholders spend more, translating to higher purchase volumes. As the number of cards and average spend per card increases, purchase volumes will rise.
MA take-rate for domestic spending is ~13bps:
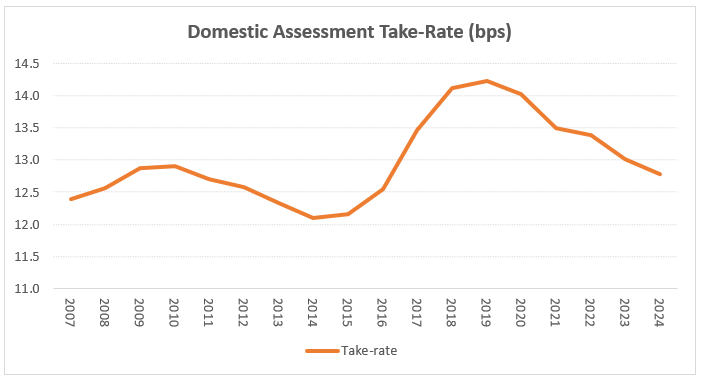
The recent falling take-rates come from regulatory pressures. As a result, we can see domestic assessment volume growth lagging behind purchase volumes since 2020:
Cross-border Assessments
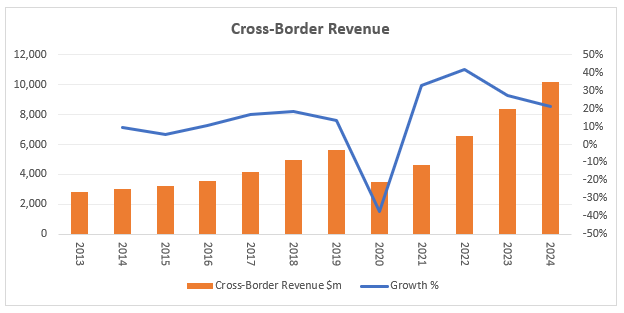
This segment captures MA card spending when the cardholder and merchant are not in the same country. Common transactions are e-commerce and travel.
Cross-border fees are high given the added complexity of handling multiple currencies and additional security. Interchange fees range from 0.2% to as high as 2.4% across some regions. It is unclear what MA take-rate is, but we are sure it is considerably higher than the 13bps they net from domestic transactions.
Cross-border volumes have recovered since COVID in 2020:
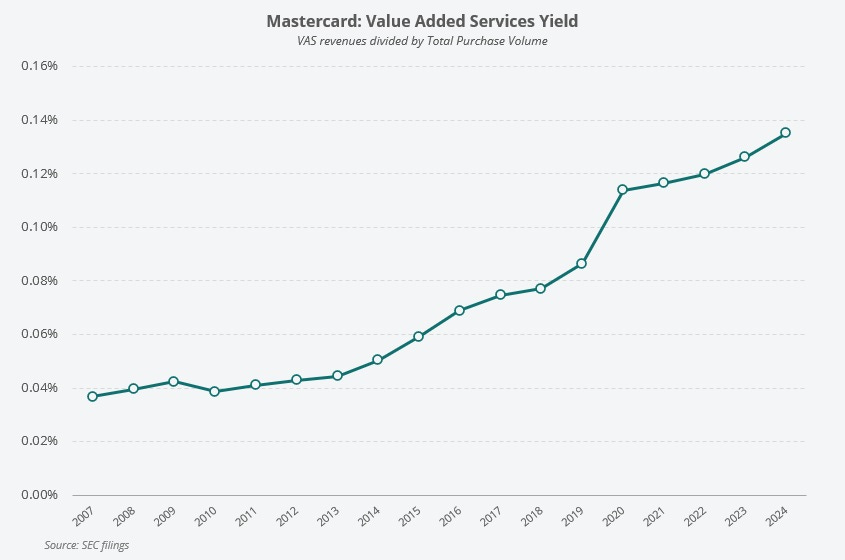
Value Added Services (VAS)
This is the other reported segment, it generated $10.8b revenues (38% share) in 2024. VAS had +17% growth in 2024, faster than +10% growth for the Payment Network segment.
Since 2019, VAS revenues have grown at 21% CAGR, significantly faster than the core business.
MA has a wide portfolio of tech products for payment participants. They include cyber and intelligence, data and services, processing and gateway, open banking and digital identity. VAS are either integrated within payment network or on a stand-alone basis.
Network-linked services that are correlated with the underlying payments growth opportunity represent 60% of VAS revenue. The remainder consists of subscription fees and non-recurring engagement fees.
Moving Towards VAS
It is expected that revenues will trend more towards VAS and cross-border.
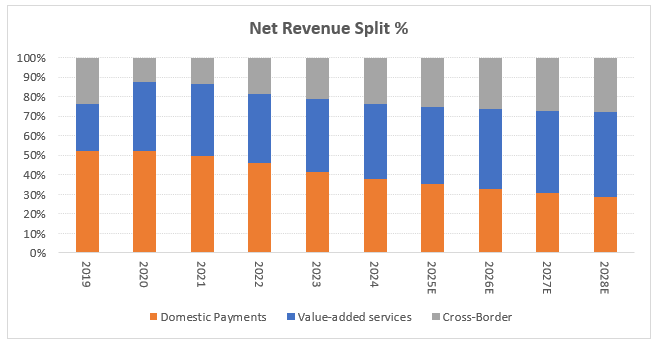
This makes MA a more valuable business in a world with increasing regulation on payment fees and where customers demand leading products from partners.
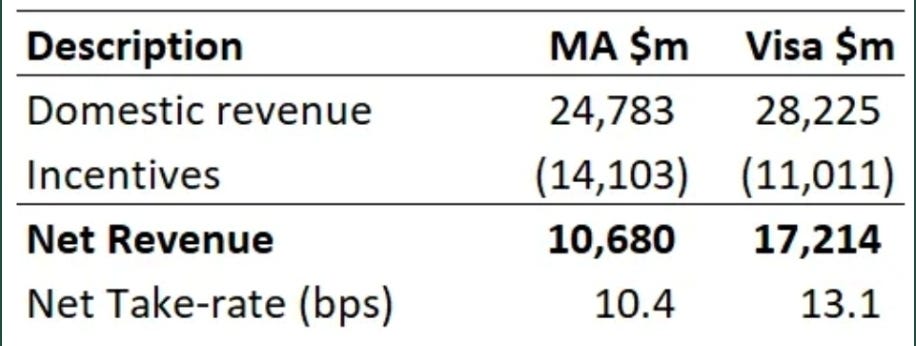
We observe a similar pattern for Visa:
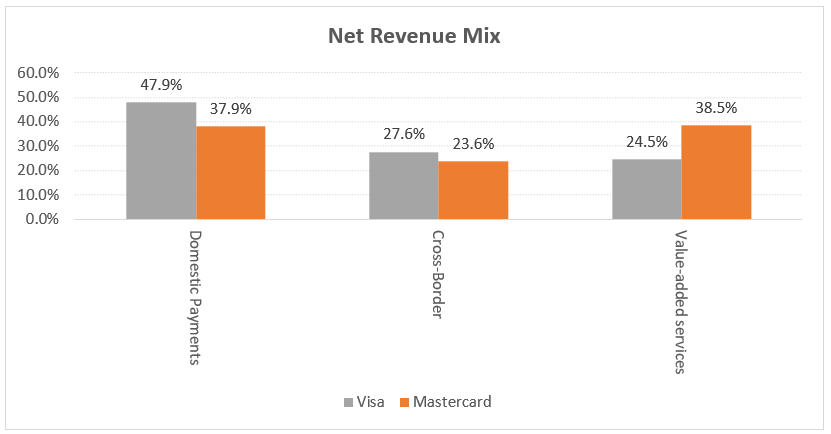
Because Visa has lower rebates and incentives, it makes more money from core domestic transactions. Therefore, its net take-rate is higher for domestic transactions. This also means it is more exposed to domestic regulatory issues.
Moat #1: Network Effects
The network payment industry is essentially a duopoly with MA and Visa.
This has driven a two-sided network effect where an increase in cardholders incentivzes more merchants to accept card payments. Greater accessibility has in turn led to higher card usage and purchase volumes. Financial institutions are then incentivized to issue cards.
Merchants basically accept multiple card brands, with MA and Visa being ubiquitous.
Moat #2: High Switching Cost
In relation to issuers, moving from one network to another is highly complex and involves significant risks to shift millions of cards. It is more often the easier decision to leave things the way they are.
The low failure rates and efficiencies that MA and Visa built in their networks have resulted in trust and quality.
This implies a very high barrier to entry into the payment network market.
Moat #3: Economies of Scale
Take a look at the non-cash transactions by number from the 2022 Fed Reserve study:
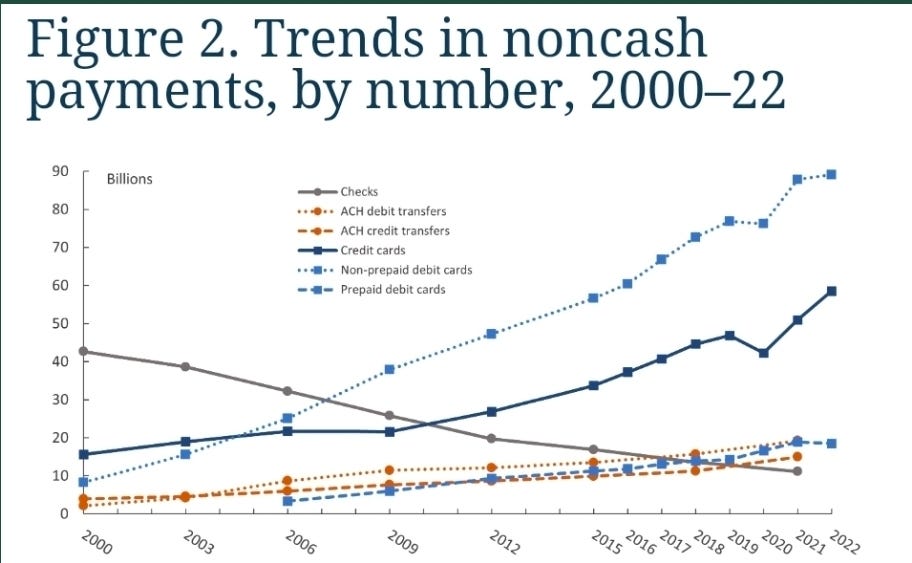
Card present growth was aided in part by an increase in contactless penetration as contactless now represents approximately 69% of all in-person switched purchase transactions.
Sachin Mehra, CFO, 2024
Although volumes increased, we have to look at the cost incurred to capture this. Since 2006, through the GFC, MA has doubled EBITDA margins from 30% to 60%.
This is evidence of economies of scale!
Every incremental transaction requires virtually zero marginal cost. Layer on top of that a plethora VAS products, and we get a compounding business.
In 2024, the CAPEX and capitalized software cash outflow is only $1.2b out of net revenues of $28.2b. That’s a capital light business.
Differentiated Business Strategy
Sources estimate that the global transactions share of Visa is declining relative to MA:
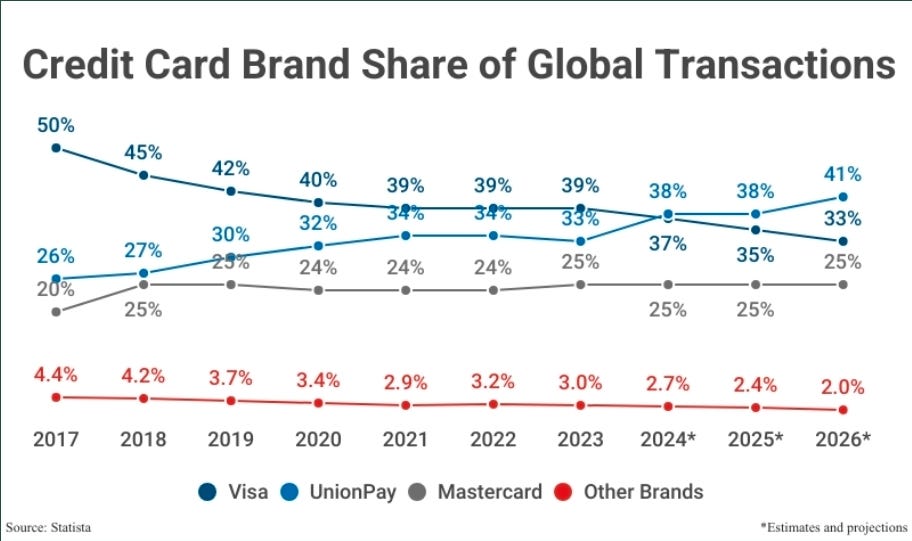
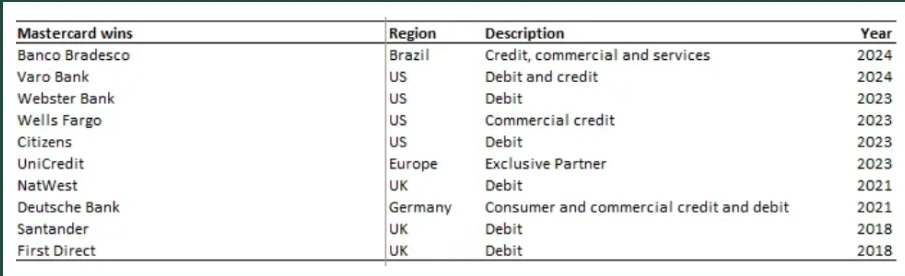
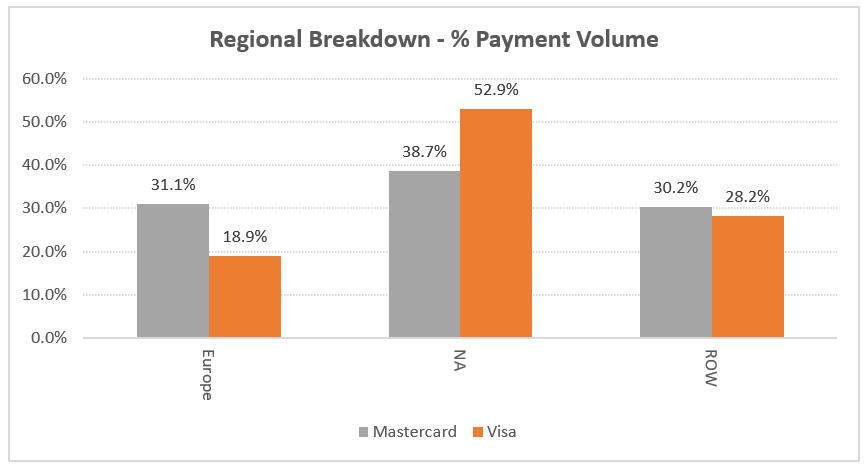
Visa has historically used its scale and vast portfolio of incentives and loyalty solutions to retain and win customers. MA has used acquisition strategies with wins in Europe and the US. As seen below, the approach is targeted and won in key areas:
MA returns a high proportion of rebates and incentives to issuers and makes less money on the actual transaction and more through cross-border and VAS.
With this business direction, MA can go into negotiations with a lower price point and can make a shift economical for issuers. Once an issuer is captured, the stickiness factor usually makes it difficult to switch.
This is counter-positioning as Visa would need to lower prices and cannibalise its existing business to compete.
But pricing alone is not sufficient to convince issuers to take MA.
This brings us to the VAS part where MA provides multiple solutions to customers.
Chief Services Officer, Craig Vosburg quotes:
We have systematically broadened that pool of data to include not just card transaction data, but identity data, device data, biometric data, real-time payments data, open banking data, payments gateway data, commercial card transaction data, buyer-supplier relationships and all of these things number in the billions, right?
So this is data at scale.
So we’ve broadened that dataset and can use that.
We see this from a list of long-term acquisitions MA has done to benefit VAS:
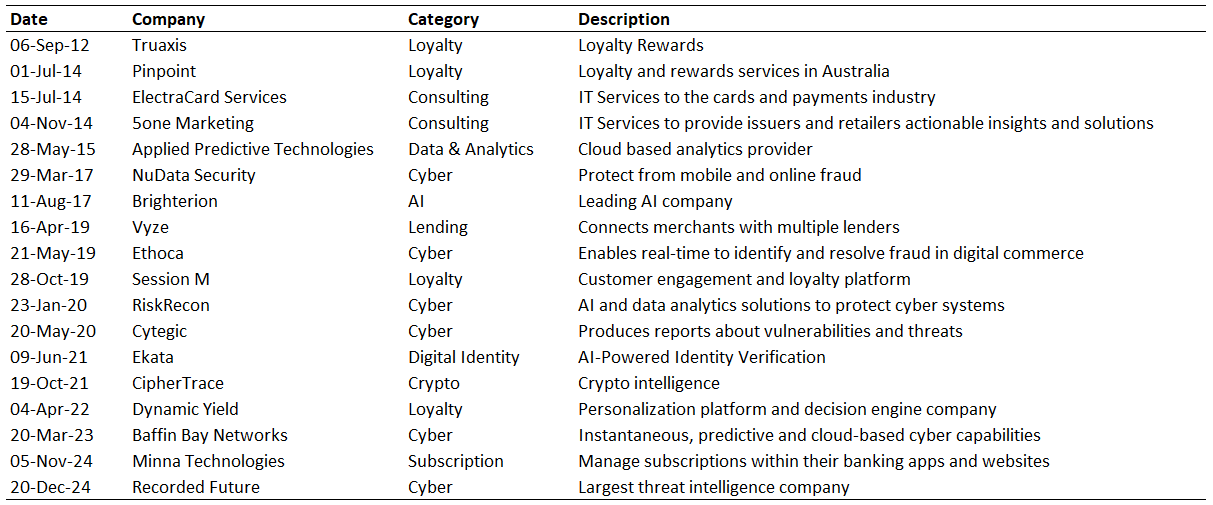
Bolt-on acquisitions have been executed methodically along with internal development to increase the breadth of products to around 30-50, depending on the region. They support these products with global consulting and advisory expertise.
Visa has made fewer acquisitions in services, cyber and loyalty and focused more on new flows and technology capabilities.
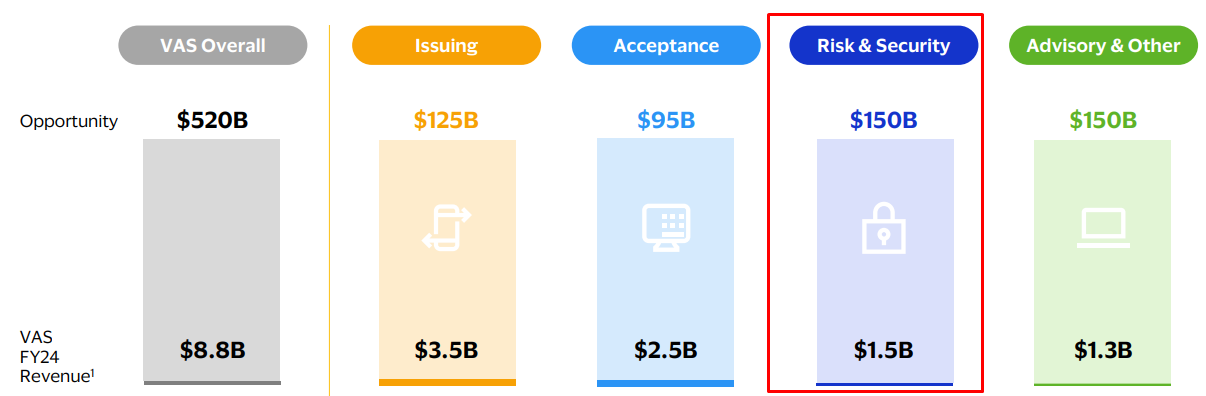
VAS Details
The VAS portfolio has expanded since its last investor day in 2021, where there were only 3 segments.
Now we have 5 segments:
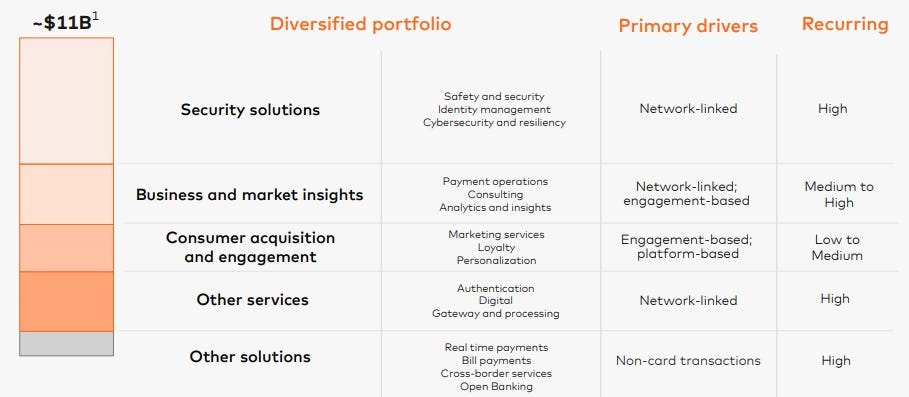
In Security Solutions, MA has significantly expanded its capabilities with 7 acquisitions in the past 8 years.
The recent one with Recorded Future is an example of how MA continues to expand its market by extending into threat intelligence.
There is an ever increasing threat of cybersecurity, and solutions for fraud prevention become increasingly critical for customers. Around 40% of services revenue is related to security.
For Visa, security and risk represents a smaller portion (17%) of services revenue. While not a like-for-like comparison, we can see from the number of acquisitions and revenue contribution that they are likely playing catch up:
Below is a list of examples of how MA has partnerships with customers, helping them solve their problems:
Varo Bank: Data insights, merchant funded offers platform.
Webster Bank: Mmarketing assets, safety and security tools for SMEs.
Wells Fargo: Bundled acceptance and issuance for SMEs.
Citizens: Digital assets, open banking capabilities, safety and security.
UniCredit: Engagement and sustainability agenda.
Santander: Digital fraud and exclusive sponsorship assets.
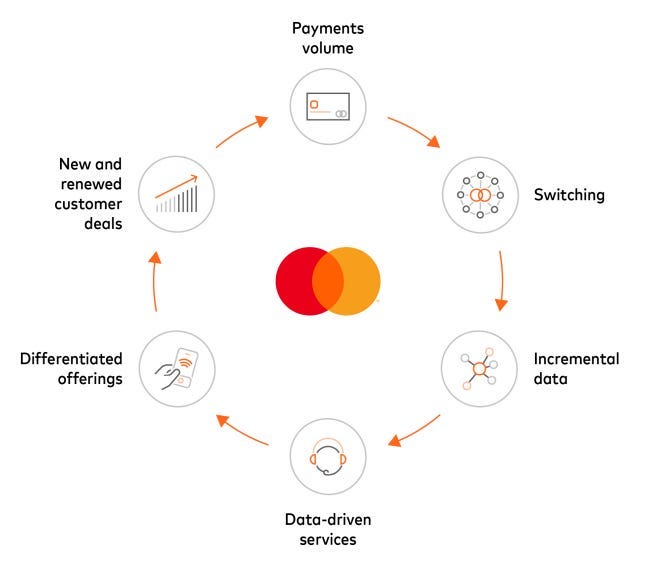
Hence, we arrive at the flywheel effect driving value creation at MA: Payments and VAS are deeply interconnected. As MA helps digitize more payments, that opens more opportunities for them to deliver VAS (data insights, consulting, cybersecurity, etc.). The growth of those services drives more digital payments.
New Payment Flows
New flows extend beyond the digitisation of consumer payments into other segments such as:
Commercial point of sale (POS).
Commercial invoiced payments.
Disbursements & remittances.
New Payment Flows are expected to be the longer term driver given the significant untapped opportunity. Commercial flows represent 13% of gross dollar volumes (GDV) today. As this segment grows faster and becomes a larger proportion of volumes, it can offset the lower growth in consumer payments over the long term.
Commercial purchase volumes have increased from 11% in 2021 to 13% in 2024 of GDV, growing faster than the core. Disbursements and remittances are around 2% of GDV and have likely grown slower. New flows represent ~15% of purchase volumes with MA share at ~1%.
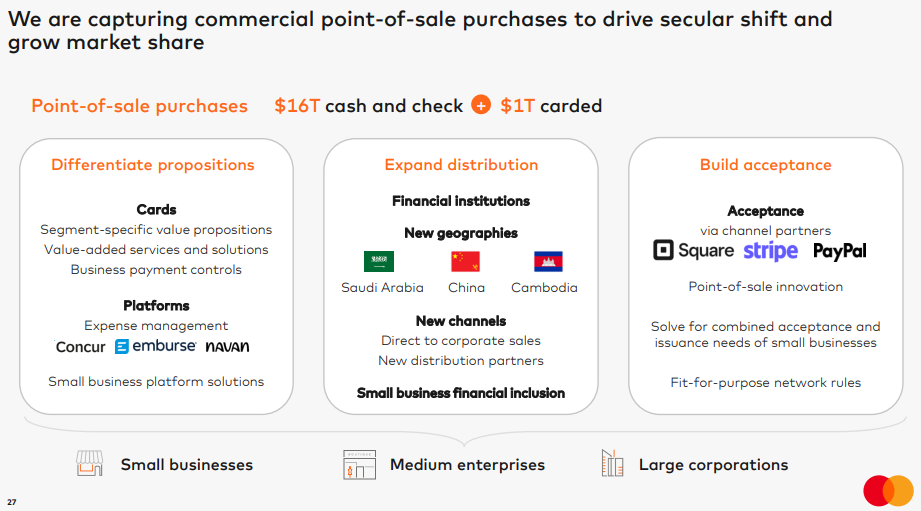
Commercial POS
The more addressable opportunity is in POS where $16t or 94% of the market is still using cash or cheque. This is when a business account holder makes a purchase at a merchant/supplier. The expectation is that businesses should eventually adopt cards like consumers.
Commercial Invoiced Payments
The proposition is harder to win as this is trying to displace bank transfers, which are digital and free of charge. Rather, accepting card payments comes at a cost to businesses.
The value proposition is that payments can be readily integrated into software platforms such as Oracle and SAP to bring automation. Suppliers can also benefit from simplified workflows and improved data reconciliation to reduce operation costs.
Disbursements & Remittances
Mastercard Move is the platform and has the capability to reach over 155 countries, more than 10 billion endpoints, and 95% of the banked population.
For cross-border, MA enables FinTechs such as Remitly and Revolut to deliver instantaneous cross-currency transfers.
Competition
Payment Networks
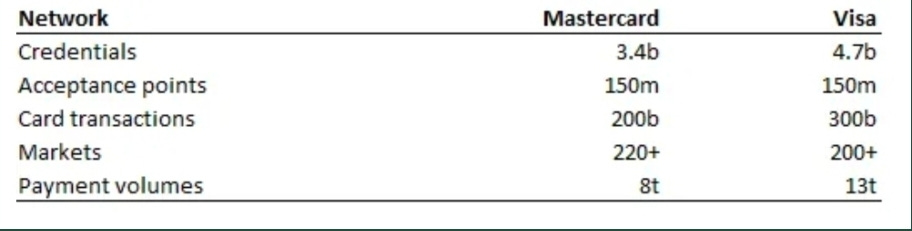
In Payment Networks, MA competes with Visa. This duopoly structure has stable dynamics where both companies have around 90% share of consumer to business (C2B) digital payments. If we include other players such as Amex, Discover and JCB, Mastercard has 34% and Visa 66% share. (Domestic card schemes such as China’s Union Pay have been excluded).
The penetration overall for cards is just a little over 50%:
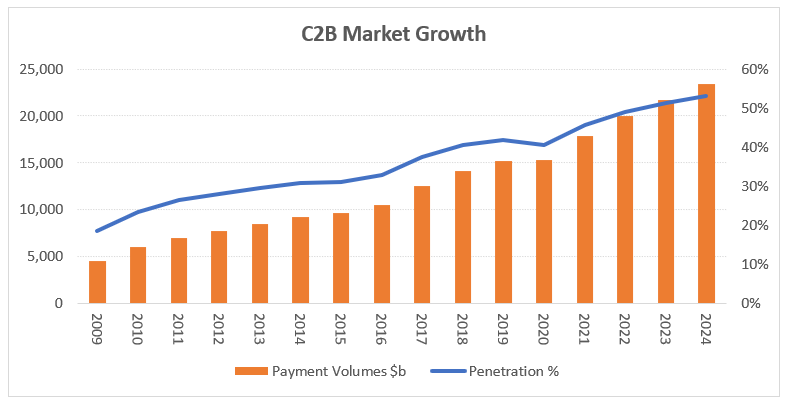
The remaining runway is to displace cash and cheque ($11t, 25%) and other forms of legacy account to account payments ($10t, 23%).
More mature countries such as Australia have 77% cards and 13% cash penetration. Global card penetration can get closer to these levels over time, albeit replacing cash and cheque at a slower pace than it has historically.
Emerging markets such as LATAM and APAC have lower levels of digital payment adoption, while their population spending growth potential is high.
Another avenue of growth can come from Maestro card conversion (these are not included in payment volumes). On July 1, 2023, MA began phasing out Maestro across Europe. European banks and other card issuers are now required to replace Maestro cards with a different card.
The conversion delivers a better cardholder experience, with the ability to shop online and across borders, and has seen a 2x lift in spend per card. There are 343m cards left to be replaced (~10% of total cards), the furthest expiry will be in 2027.
Valued Added Services (VAS)
MA shines in VAS competition compared to Visa. This segment is more fragmented with a range of players offering point solutions that support issuers, acquirers, fintechs, merchants, small businesses, and more.
We see a few levers that MA can pull to power VAS growth:
Recurring network-linked VAS revenues will grow with underlying transactions. This comes from higher card penetration in developing countries.
Price increases for subscription VAS.
Growing modules per customer. This has expanded from 3 to 5 services per transaction from 2021 to 2024.
Continued inorganic growth through M&A.
VAS is also layered on new payment flows. MA is growing credentials by partnering with FinTechs and expanding distribution into new geographies. MA is also integrating solutions around expense management, reporting, reconciliation and data insights to reduce friction. It has a solid proposition and has won multiple co-brand deals to position them for continued share gains.
If we plot the VAS revenues against purchase volume, we get evidence of increasing yield for VAS:
New Payment Flows
Visa is likely winning at disbursements & remittances: Visa Direct has grown transactions at +40% CAGR since 2019 and is partnering with a range of leading players. Visa likely has a stronger proposition, especially in cross-border.
Closed Loop Networks
A closed loop network means these companies are both the issuer and acquirer, allowing them to capture the majority of economics.
AMEX is a significant player in credit cards, but they do not offer debit cards. AMEX targets a niche set of affluent customers with high spending in sectors such as travel and hospitality. It has a strong US presence and makes money from card fees, interest revenue, and service fees, which makes it similar to a bank.
DISCOVER is a US based network that is also closed loop. It is being acquired by Capital One, with the likely outcome that Capital One will move its debit and potentially credit over time to this network. MA is the current network provider and should lose some revenue here.
Risk #1: Regulation
A constant trend has been to impose caps on interchange fees. Although the rates are set by the networks, the fee is received by the issuer. We have seen interchange fees compress across many developed markets, where previous rates >1% have fallen to these levels:
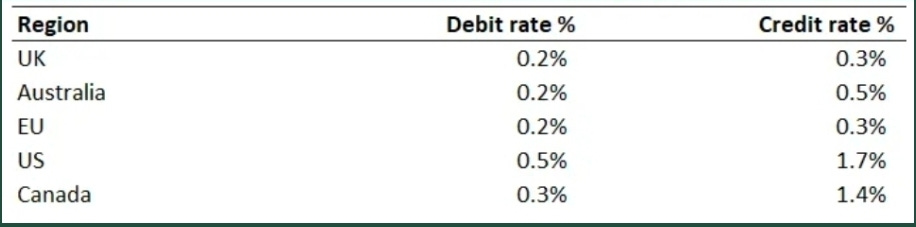
To counter this, MA and Visa have been reducing rewards and increasing fees.
US debit interchange fees continue to remain higher than developed market peers. Debit regulation was first implemented in 2011 under Regulation II of the Durbin Amendment. This capped the interchange fee to no more than the sum of $0.21 + 0.05% of the value of the transaction.
The Federal Reserve has recently proposed new rules to lower the cap to about $0.144 or 0.29%. While there is opposition from the American Bankers Association, the changes would bring debit rates on parity with other countries.
US credit interchange fees are high and have seen less regulatory pressure. The system has generous rewards programs that encourage more card spending. Merchants have gone with lawsuits attacking MA and Visa interchange fee rates, as merchants are the ones paying for it. As card penetration gets to more mature levels, we can expect lower interchange rates.
As MA focuses on volumes outside of the US, it will offset some pressure from interchange rate compression. Compared to Visa, we think that MA is better positioned in this aspect:
Risk #2: Powerful Merchants
It’s no surprise that merchants will try to pressure network fees because they are the ones paying most of it!
Large merchants such as Amazon and Walmart have significant influence and buying power. These players have encouraged regulators to review scheme and interchange fees. While some have negotiated incentives from networks to accept their products.
For example, in 2021, Amazon threatened to stop using Visa cards in the UK due to high fees and struck a global deal before resuming payments. The growth of co-brand cards also provides further bargaining power merchants.
Risk #3: Alternative Networks
Companies such as PayPal, Block, Stripe and Revolut are facilitating account to account transactions that bypass card processing. Many of these providers have developed systems targeting e-commerce and mobile channels.
There are global players that have made solid progress. For example, MobilePay in Denmark has 4.4 million users or 3/4 of the population using its platform and most are between ages 20-39.
In Poland, the account to account solution offered by Blik, launched in 2015, accounted for almost 70% of e-commerce spending in 2022.
However, there are still some advantages for card payments:
Average transaction time is faster.
Lower fraud risk, ability to transact at higher amounts.
In reality, digital wallets have increasingly partnered with card networks to build scale and increase opportunities. To fund digital wallets, usually it is done via card payment.
Financial Model
Payment networks have the attractive characteristics of a “toll bridge”. They are capital light businesses which require minimal incremental costs to scale. They don’t own the POS infrastructure, and are not exposed to credit risk. Rather, it is the merchants who need more payment processors and issuers (banks) who extend the credit.
Therefore, the gross margin profile is very high:
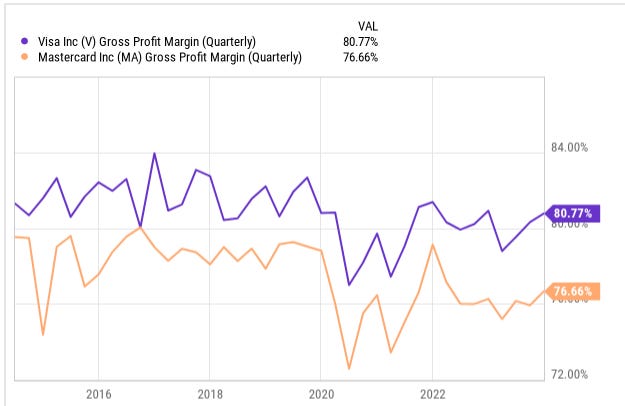
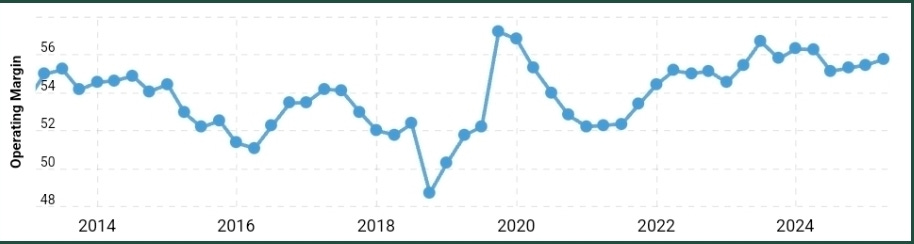
Operating margins for MA has held steady over time. The main expenses are salaries in product and technology, data processing and telecomms, and marketing.
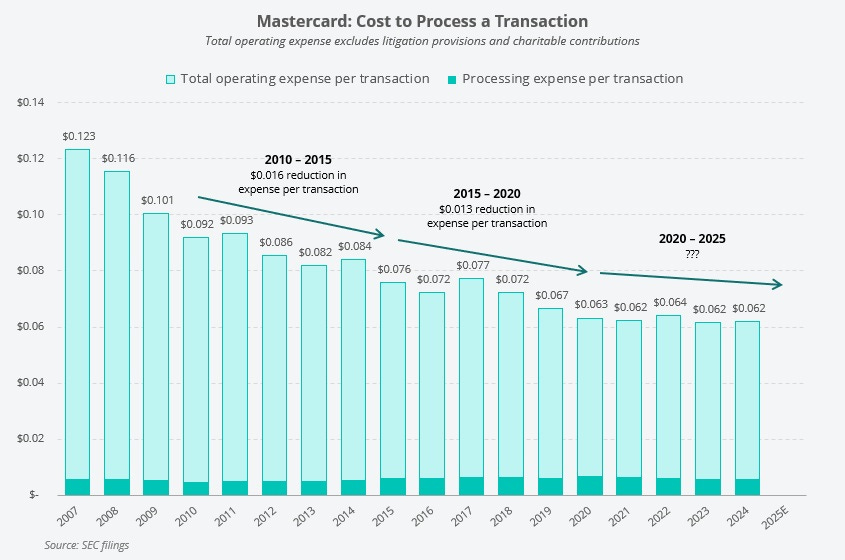
If we look at the cost per transaction, there is evidence of scale economics. But the recent years did not show lower unit costs, likely due to expenses incurred to expand the VAS segment:
Taxation is expected to be a headwind. MA has benefited from tax incentives in Singapore, which resulted in near zero taxes for Asia-Pacific revenues. From 2025, these tax benefits will likely be offset due to OECD Pillar 2 guidelines imposing a global minimum tax rate of 15%. The estimated tax rate headwind is 4%, which impacts future earnings by 4-5%.
As expected of a cash generating business, MA converts ~100% of net income to free cashflows (FCF).
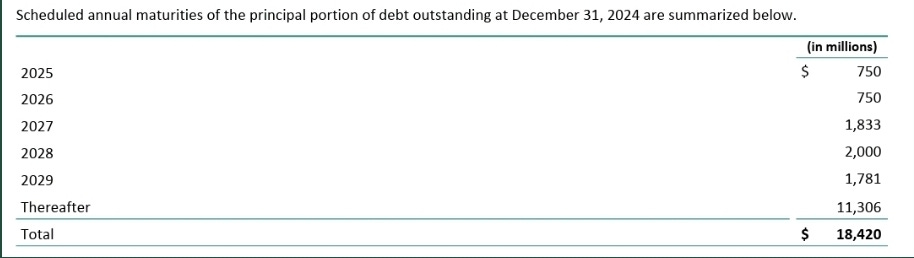
Long term debt is $17.5b against cash of $8.4b. Interest expense of $646m is more than investment income of $327m. Maturities are mostly after 2029:
Management & Incentives
CEO Michael Miebach: Tenure 14 years, $67.6m worth of shares (salary $1.25m).
CSO Craig Vosburg: Tenure 18 years, $66m worth of shares.
CTO Ed McLaughlin: Tenure 19 years, $39.7m worth of shares.
CFO Sachin Mehra: Tenure 20 years, $37.4m worth of shares.
CPO Jorn Lambert: Tenure 22 years.
CIO Ken Moore: Tenure 8 years.
Incentives are centered around revenue and earnings per share growth.
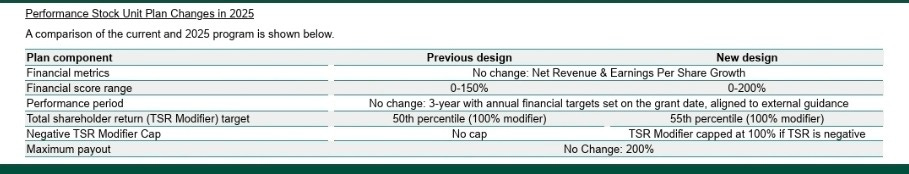
Note: They removed the ESG modifier in 2025.
Valuation
Obviously, everything we wrote above is already known by the market. The valuation won’t be cheap.
Do a reverse DCF to solve for the current market cap of $523b:
Starting FCF $13.5b (SBC $0.5b is included)
Discount rate 9%
Net debt $9.1b
FCF growth rates have to be +15% for the first 10 years.
The past 3 years FCF grew at +10.5% CAGR.
Another way to look at it:
Average ROIC = 48%
PE = 39x
IRR = 10%
Implied intrinsic value growth is 8%. If future ROIC is stable, then the reinvestment rate required is about 17%.
In our opinion, good expectations are fully baked into the price.
Notes on Future Growth
At the Investor Briefing, management has suggested that purchase volume growth could be 9%.
We estimate that the attribution is:
Emerging markets card penetration, high personal spending growth: 4%
Reduced cash/cheque from B2B transactions: 1.5%
Market share gains: 1%
Maestro replacement: 1%
New Payment Flows: 2.5%
Conclusion
Putting an emphasis on VAS makes sense for MA. The payment network business has faced near constant pressure from governments, regulators, and retailers. These groups have continuously complained that the fees the payment networks charge are too high. And yet, there is little acknowledgment from these antagonists of the enormous value the payment networks provide to everyone.
MA since IPO in 2006 has grown and maximized its network given the aggressive regulatory pressure while at the same time investing heavily in VAS businesses and revenue streams that do not have the same regulatory pressure and scrutiny.
VAS revenues will eventually eclipse revenues from their payment network.
Despite their historical success in displacing cash and introducing new ways to transfer value, the opportunities to grow and grab market share remain enormous.
In the US alone, 27% of all transactions are still done with cash. Emerging markets have a much lower card penetration rate.
Invoice payments are estimated to be a $63t market, and only $2t of that is on cards.
VAS market is estimated to be $165b with MA only having 6.5% market share.
This quote from Joe Nocera’s book: A Piece of the Action (1994) summarizes the wonder of cards processing:
It’s a complicated array of things you don’t see, but it all happens so quickly and smoothly that you don’t even think about it. Here, then, was another paradox: computers weren’t important only because they managed highly complex tasks; they were important because they disguised highly complex tasks. By making a complicated process invisible, computers allowed people to forget about the complexity and focus instead on what was visible: namely, how easy the thing was to use.