
GOOGL: Alphabet (2)
Intro
We have written about the business economics of GOOGL in the past here. This post will attempt to address the question of whether GOOGL is able to get a good return on invested capital (ROIC) on their enormous CAPEX investments.
As management continues to reiterate their bullish expectations, we have not seen them quantifying these statements.
It’s common sense to believe that earning high returns on hundreds of billions of dollars must be very difficult, especially against other hyperscalers like Microsoft, Amazon and META. These competitors have deep talent pool, generate lots of cash, and boast fortress-like balance sheets.
Then when we pull up GOOGL ROIC chart, it doesn’t look hopeful:
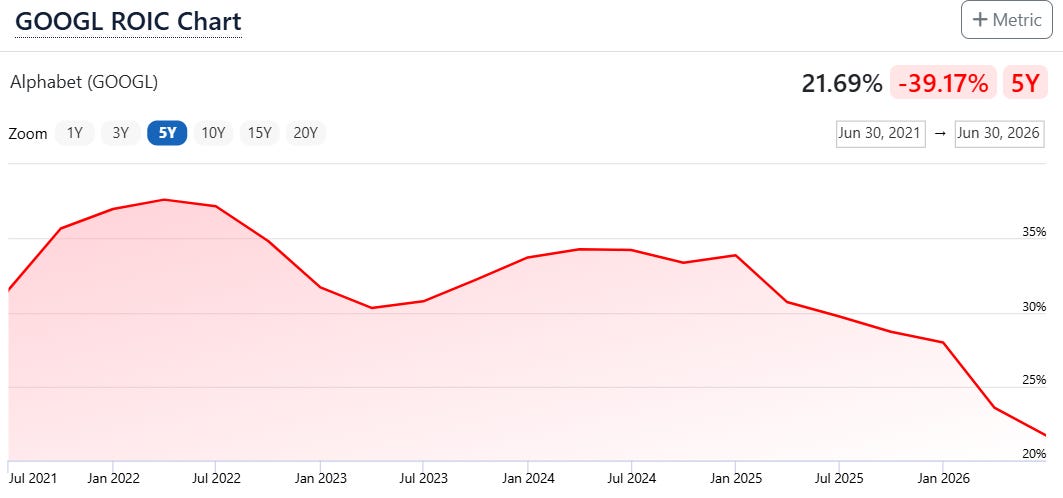
The business used to be asset-light and now evolved to asset-heavy, the last 5 years (2021 — 2025) saw CAPEX go from $25b to $91b. This year GOOGL is expected to spend more than double at ~$197b.
Assets In Service
However, we must be aware that the way ROIC is calculated above is useful only for looking at long-term trends. There’s nothing wrong with the academic way of taking net operating profit after tax (NOPAT) divided by average invested capital.
But we need to appreciate the nuance in the numbers, if we want to know what’s the return on the most recent CAPEX. Because in reality, not all CAPEX spending is productive at once — we must differentiate between assets “in service” and “not in service”.
The details are in Note 7. Property and Equipment (PPE):
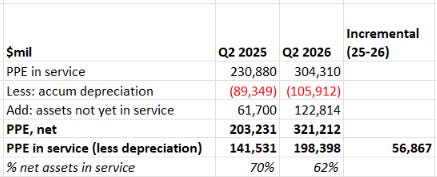
Notice that as of Q2 2026, out of total PPE of $321b, there were $123b of assets not yet in service. In other words, these assets don’t contribute to earnings and should be removed from ROIC calculations.
For LTM, GOOGL had $56.9b of net assets in service.
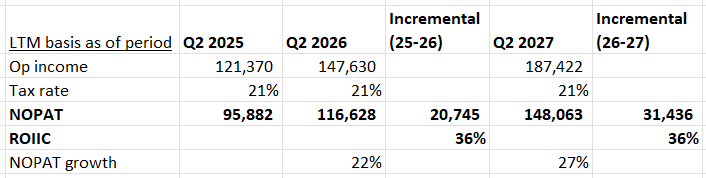
So how much incremental NOPAT did they generate over this period?
It was a very impressive result of $20.7b, representing +22% YOY growth and return on incremental invested capital (ROIIC) of 36% (=20.7/56.9).
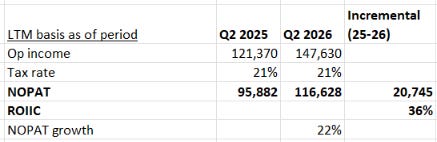
This is a very good return considering the fact it is on $56.9b of incremental new assets, not existing assets! We can’t think of many businesses which are able to invest such large sums and still get 36% returns. Indeed, a wonderful business is one that can deploy huge amounts of capital at good incremental rates of return.
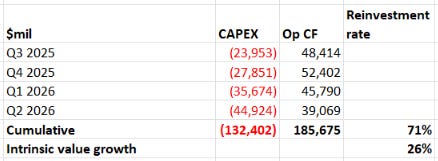
Now we can look at GOOGL reinvestment rate and estimate intrinsic value growth. Over LTM, reinvestment rate was 71% with ROIIC 36%, we estimate that GOOGL grew intrinsic value at +26%. It checks out with NOPAT growth of +22%. It still amazes us that such a large company can grow at over 20%.
Future Growth Rates
So far we have been only looking backwards in time. How about the future growth from all these CAPEX investments?
Let's model it with some assumptions:
$123b of assets not yet in service goes productive by Q2 2027.
Depreciation 10 years for these assets.
Additional new assets $240b (guidance $60b per quarter CAPEX).
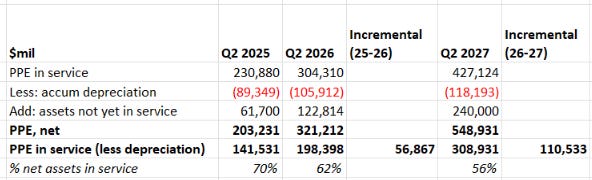
Under these assumptions, the NTM incremental net assets in service will be $110.5b.
If ROIIC for next year remains constant at 36%, we can expect NOPAT to grow +27% YOY, which translates into intrinsic value.
Below is a sensitivity table with different ROIIC scenarios:
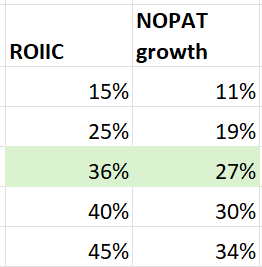
We think this is the baseline that investors can work from. There are a few upsides that can improve the outcome:
The model didn’t account for returns on new additional CAPEX.
TPU hardware sales that are expected to be material in 2027.
Earnings from renting compute from SpaceX (GOOGL wouldn't sign this $920m per month deal if foreseeable demand was weak).
Certainly, part of this rising CAPEX is due to very expensive memory chips which is a drag on incremental returns unless GOOGL can pass the cost to customers. Even if we assume $10b of assets is due to price inflation and cannot be passed on, the effect of NOPAT growth is not large (from +27% to +25%).
This supports the fact that management sees enough upside to continue investing despite high hardware prices.
Admitting Mistakes
In summary, we think the odds are in favour of GOOGL making a good return on investments. We are seeing very quick returns that materialized on assets that barely went productive for 1 year. It would be less optimistic if returns took years to appear.
We own up to our mistake of selling a substantial stake in the past (GOOGL used to make up 30% of our portfolio). Although we made a good return on the stock, we didn’t fully appreciate the nuances of assets that were in/out of service.
Such mistakes are valuable learning points — we call them “errors of omission” — they don’t show up anywhere on our financial statements, unless we discuss them openly.
For our fund holders, we can guarantee that there will be many more errors of omission in the future!
I understand. But i think we have to assign probabilities to each case and model out the weighted outcome - unless you're hinting that demand dying off scenario is very high probability.
The reason why i think the IRR is likely to be high than low: you have a biz that can invest large sums of money with fast profits, when cash inflows are quick it favours the IRR math. The cashflow can slow down in the later years, but their present value impact is not greater than those immediate earnings google is receiving.
Very interesting take on the nuances of roic. But I'd note two things: the hyperscalers are depreciating hardware over 6 years, not 10. And that number seems still too generous. Additionally, profits are dependent (partially) on the hype around AI. If enterprises scale back their usage, profits will decline (regardless of the future succes of the technology).