
Study: PE Ratio Across Time
Broken Measurement
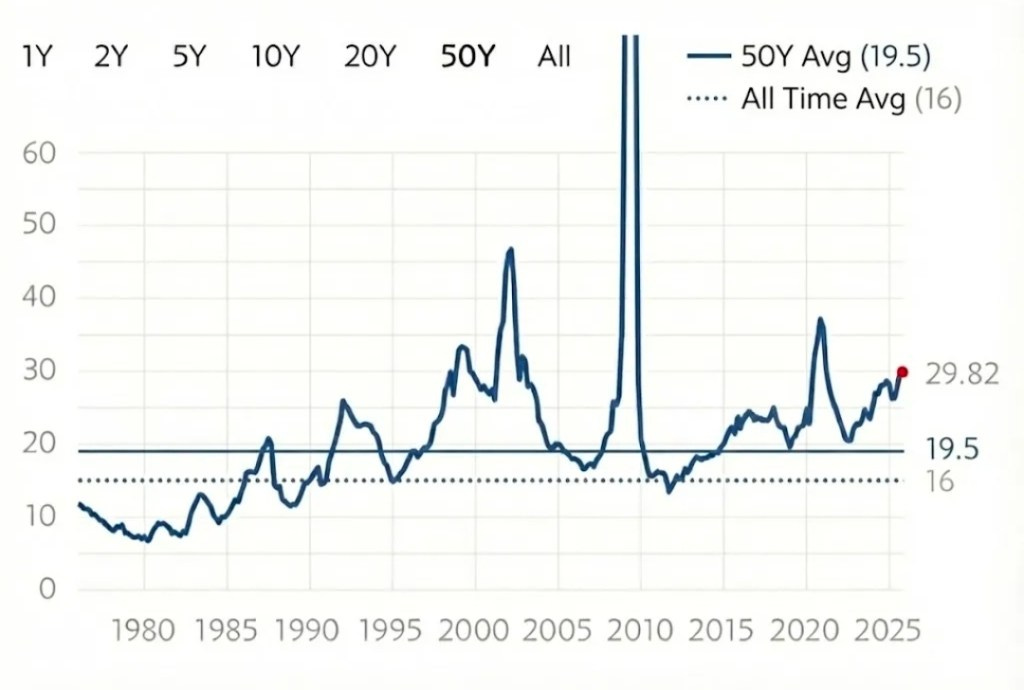
Lately, this graph above is mentioned alot, it’s the PE ratio of the S&P500 index since the 1970s. From all the AI bubble talk, critics often point to the current 30x PE ratio being too high against the average 19.5x, and mean-reversion should happen causing stock prices to tank.
However, did you know that the accounting rules of the past is significantly different from today?
Simply comparing earnings across time is lazy analysis if we don’t adjust for these differences.
Over the last two decades, there have been several major accounting changes that have changed the way companies report profits. Most changes have made today’s accounting more conservative, suppressing reported earnings compared to the past. Much of today’s accounting is more transparent and rational, but it makes comparison cloudy.
So what are these changes?
Let’s take a look at the major ones…
Stock Based Comp (SBC)
Did you know that SBC was only required to be recorded as an expense as of 2006?
Before 2006, companies could issue massive stock options, dilute shareholders, and report zero expense on the income statement. SBC prior to 2006 had no impact on earnings per share (EPS). That ended with FAS 123(R), which requires companies to expense the fair value of employee stock options and other share-based payments on their income statements instead of just disclosing it in footnotes.
Today, SBC is recorded as an expense and directly reduces earnings. Indeed, this is a rational representation.
For context, the SBC in S&P500 companies has grew significantly. In 2015, SBC was 0.5% of revenues, just 7 years later in 2022, SBC more than doubled to 1.2% of revenues (or $192b).
An interesting note: Berkshire replaced Gen Re stock options program in 1998 post-acquisition, voluntarily paying cash incentives so that their financials reflected the true expense to shareholders:
Though the two (incentive) plans are an economic wash, the cash plan we are putting in will produce a vastly different accounting result.
This Alice-in-Wonderland outcome occurs because existing accounting principles ignore the cost of stock options when earnings are being calculated, even though options are a huge and increasing expense at a great many corporations.
In effect, accounting principles offer management a choice: Pay employees in one form and count the cost, or pay them in another form and ignore the cost. Small wonder then that the use of options has mushroomed.
Berkshire shareholder letter, 1998
Today, SBC probably accounts for roughly 10–15% of total S&P500 earnings. If we applied today’s rules to the past, the historical PE will be higher.
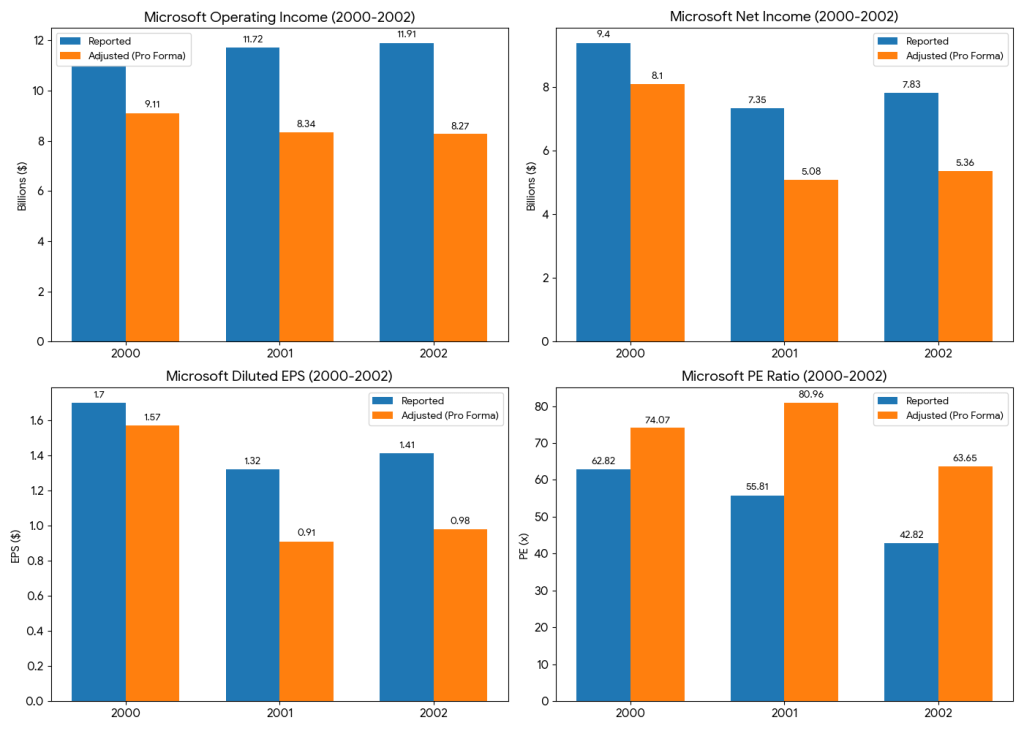
For example, we can restate SBC as an expense and see the “adjusted pro forma” effects for Microsoft from 2000 to 2002 (dot-com peak). We summarize it below, clearly PE ratios would be much higher:
Intangibles Amortization
Beyond SBC, the American economy has changed and the companies that make up the S&P500 have shifted from companies with tangible assets (factories, plants, equipment) to intangible assets (IP, software) and current day accounting rules penalize this shift in regards to valuation.
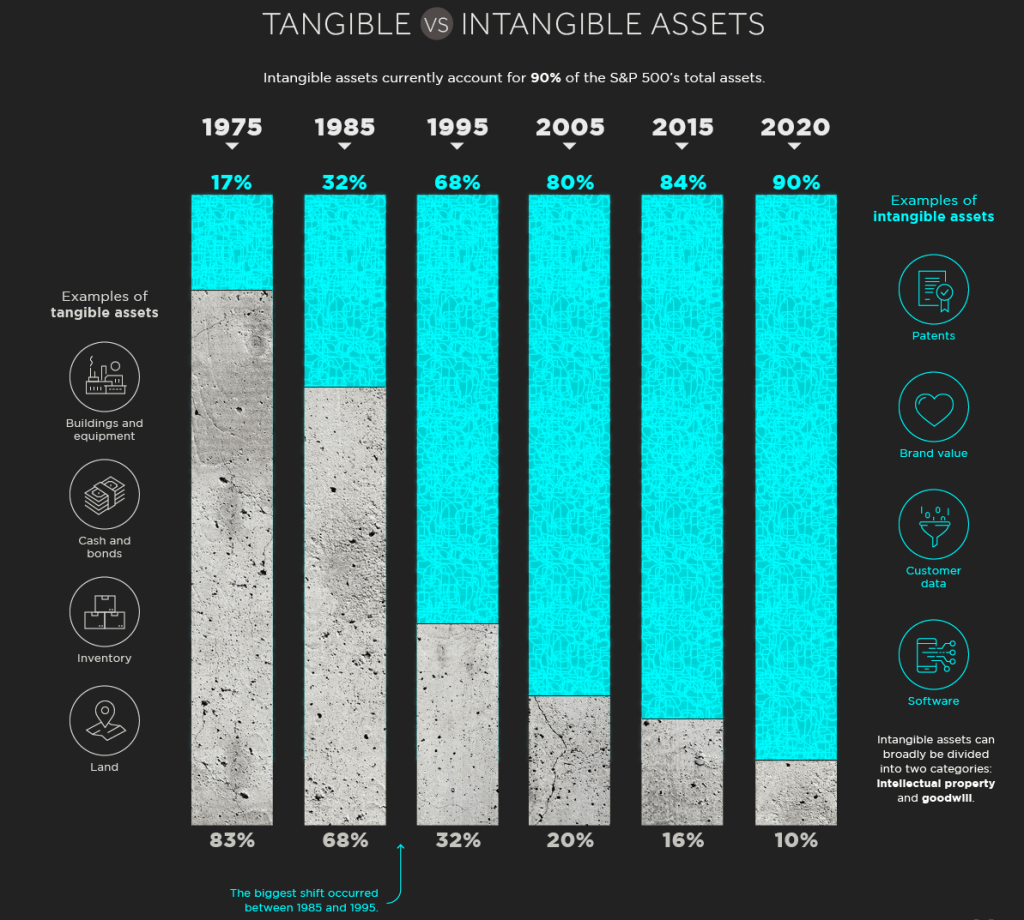
Back in 1975, intangible assets made up just 17% of assets on the balance sheets of S&P500 companies. 50 years later, intangible assets were 90%!
This is due to software and tech companies becoming the heaviest weighted sector by market capitalization.
When M&A proliferated after the late 1990s, the sums paid to acquire intangibles must be amortized. This difference is one of the contributing factors between GAAP and Non-GAAP earnings.
R&D Expenses
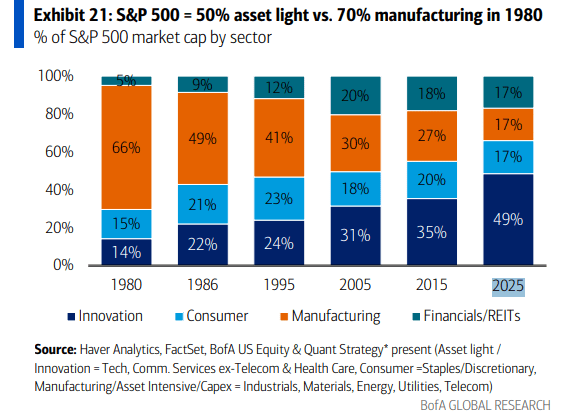
This fact is well-known: The American economy has moved from CAPEX intensive industrials to capital-light businesses. When an industrial company buys a factory it will depreciate the asset over many years. But when tech companies invest in R&D, it is fully expensed off in the first year, although the benefits of R&D logically spans over several years.
See the evolution of capital intensity over the years:
Michael Mauboussin explains it well and expresses caution when comparing multiples across different time periods:
The global economy continues to shift from one built on tangible assets to one built on intangible assets. Accounting, the means by which financial information is presented, treats tangible and intangible investments differently. This introduces bias into common metrics such as earnings.
Most intangible investments appear on the income statement. Capitalizing those investments treats them in a fashion similar to capital expenditures. The result is that earnings and investments increase the same amount. This leaves free cash flow unchanged but provides a more accurate picture of a company’s operations.
Given the assumptions we use, the capitalization of intangible investments would lead to net income for the S&P500 that is about 12% higher than what is reported. These figures suggest great caution in comparing earnings or multiples over time.
Concentration in S&P500
A common warning people give is that the S&P500 is too top-heavy. The market is so concentrated.
But the S&P500 is a market-cap weighted index by design. It is not meant to be a representation of the average business!
The index is built to let winners run and dropping the worst performers. When people caution that “Mag7 is driving the index” they are essentially implying that the winners are winning and that the strategy is working as intended.
Furthermore, looking at Mag7 as just “7 stocks” is misleading because most of them are extremely diversified.
1. Amazon is a retailer, a logistics company, an advertising agency, a Cloud hyperscaler…
2. Microsoft has enterprise software, Cloud hyperscaler, gaming studio…
3. Google is a Cloud hyperscaler, search advertiser, AI research, entertainment services, designs it own TPU chips…
You get the point: These companies have diversified businesses and they command high multiples because they deliver great products and profitability.
In fact, Mag7 as a group has twice the net income margins (26%) versus S&P500 (13%).
If you choose to buy the S&P500 index, you are making an active choice to bet on the winners. Worrying about concentration is contradictory.
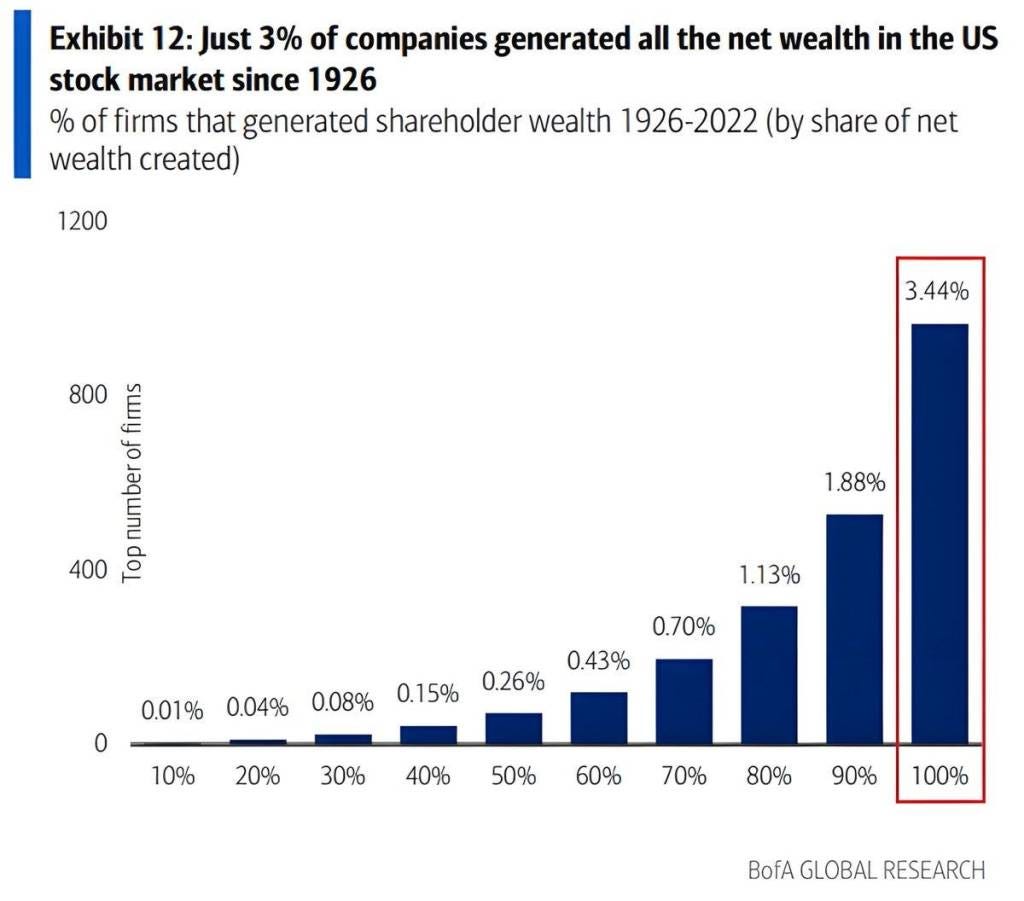
To demonstrate this, only 3.4% of companies generated all the net wealth in the US stock market since 1926:
Normalizing the PE ratio
Let’s see what PE multiples look like under pre-2006 rules:
Add back SBC expense. Earnings +12% (assume 10–15% net income is from SBC).
Amortize intangibles. Earnings +12% (source: Michael Mauboussin).
Doing the reverse, we apply today’s accounting rules on pre-2006 earnings.
We get a comparable PE ratio graph across time periods with year 2006 as the pivot point:
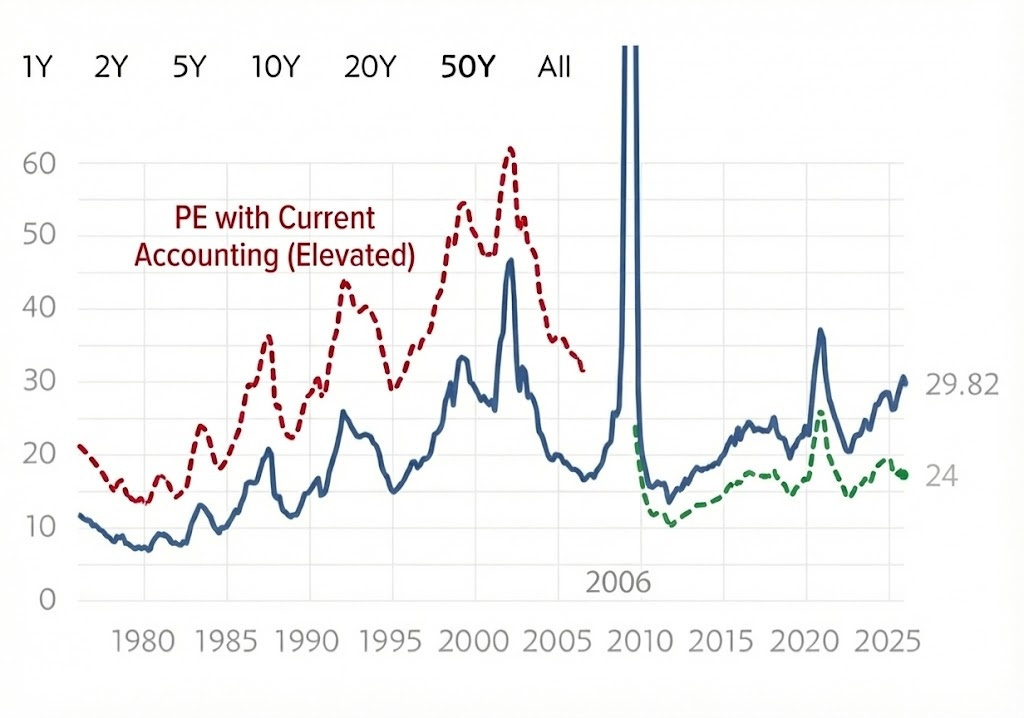
Red line is higher due to treating SBC as an expense pre-2006.
Green line is lower due to amortization of intangibles (post-2006 SBC is already expensed).
This exercise has 2 concluding observations on the PE ratio:
1. Dot-com bubble era under current accounting would be much higher at over 60x, compared to today’s 30x multiples.
2. Average PE adjusted across for current accounting rules is higher than the 50-year simple average 20x.