
Study: Financial Data Value Chain
Preface
The financial data industry is the nervous system of modern markets, transmitting millions of signals each second, through a complex yet structured system.
This is especially pronounced in the US financial markets, the deepest and largest market in the world. This decentralized system comprises dozens of specialized firms each contributing to the value chain in their own distinct way.
This value chain is being built on public information, yet it generates significant private value. To express where value is captured, we explore the different functions of data when it moves through the system.
Three Points of Control
Companies in the financial data industry capture value in entirely divergent ways across 3 distinct stages. As leaders in their respective domain, each company has different levels of control over the data that passes through them. As a consequence, their individual business models are shaped by the unique properties of each stage.
Stage 1: Production
This is where raw financial data originates. CME is a dominant player in this domain, being the world’s largest derivatives exchange that processes trillions of notional future amounts.
Global trading activity is mainly captured by centralized, licensed exchanges that match supply and demand for specific instruments and securities. CME (along with Nasdaq, ICE & CBOE) operate the world’s largest futures and commodities exchange. In this marketplace, traders speculate on everything from interest rate futures to soybeans contracts. However, while CME’s primary business is matching buyers with sellers, it’s also one of the world’s most important producers of financial data.
Whenever traders agree on a price, CME executes their trade for a fee, creating a data point. Millions of these trades generate a constant stream of price data. The exchange simply provides the mechanism to execute buy and sell orders. The participants create the price from their own trading, and CME then gets to own it as a data point.
These data ownership rights are a key advantage of operating an exchange. Another is the perpetual motion machine of price discovery. When CME executes a trade, people react by adjusting their positions and orders, which creates new trades, generating fresh prices and data points and the cycle continues.
We can already see network effects and cornered resources advantages accrue to CME.
The constant price update leads to a continuous data stream. Together, these form a formidable moat that gives CME a dual income stream: transaction fees for each trade and licensing fees for the price data.
Unfortunately, simply having direct access to a waterfall of pricing data is not good enough to make trading decisions. For example, prices of corn futures does not just depend on trades executed on CME, it depends on many other factors like weather, export data, shipping rates, FX movements, storage costs, inflation expectations etc.
These sources of data are dispersed and disjointed. Who arranges these data points into usable information?
We move on to the next stage…
Stage 2: Distribution
Here data is aggregated, transformed and delivered. FactSet is an example in this space, performing data collection and standardization, then packaging it to users. This stage adds value by organizing and packaging raw data, turning data into usable information.
Obviously, it is very difficult to consolidate data in every format and frequency, furthermore rearranging them into usable information. FactSet (along with Bloomberg & LSEG) operate in this space.
FactSet built an incredible technology infrastructure to collect, clean, catalogue and deliver data to end users in a way that creates value.
As part of doing this distribution work, FactSet collects subscription fees. They have a workstation (similar to Bloomberg) that gives structured information to users, who then perform their own analysis and screens.
Process power advantages accrue to FactSet in this stage.
Stage 3: Activation
Usable information arrives here and is analyzed and converted into proprietary insights. MSCI (along with S&P Global) operates here producing indices and benchmarks. This stage adds value by adding context and meaning.
Value creation happens in 2 main ways:
Computational: Transforming data into measurement tool (indices)
Analytical: Expert interpretation through research (credit ratings)
These companies charge licensing fees for benchmarks and saw the rise of ETF providers as passive investing gained popularity. These ETF pay a fraction of AUM to MSCI, this fee income is like a tax on the entire market irrespective of the investor type.
The best example is the S&P500 index which is attached to almost all fund managers factsheet. While most of the methodology is publicly disclosed, index providers hold back just enough to protect their intellectual property.
Scale advantages accrue to companies in this stage; once a methodology is created it can be adopted at scale and more adoption attracts more customers.
Clarifications
These 3 examples (CME, FactSet, MSCI) we picked are due to their pure-play nature. Unlike their diversified peers which make blend across stages, these 3 companies make for cleaner case studies for understanding the economics.
When we say “financial market data” it means capital markets data like prices, yields, trades and company financial statements. These data drive investment decisions. We don’t consider other forms of data like payments and banking which make up the broader financial market dataset.
Value Capture Curve
In 1992, Stan Shih (founder of Acer) made an observation that Acer earned thin margins assembling PCs while Intel and Microsoft captured all the value through chip design and operating systems. Even retailers could command a premium through brand and distribution.
This observation is similar to the economics of financial data. The middle stage captures the least value, while the upstream and downstream takes most of it.
How can we measure value capture?
We think these 4 measurements are appropriate:
Operating margins: Higher margins indicate higher pricing power
Revenue per employee: Better unit economics indicate better excess profits
High dividend payout ratio: Indicates capital efficiency
Low CAPEX to Free Cashflow ratio: Indicates capital efficiency
Ranking the various players in the industry, we get the orange value capture curve:
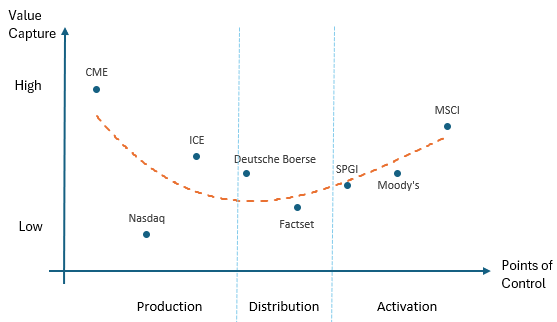
Note: We left out Bloomberg and LSEG in the diagram as they operate across the points of control.
CME Group
In the Production arena, CME is a fabulous business. The revenue per employee is very high at ~$1.6m compared to tech giants like Apple ($2.4m), Alphabet ($1.7m), Microsoft ($959k).
It enjoys natural monopoly economics by design because there is a high regulatory wall to get licensed and high capital requirements to operate. So it’s not surprising that exchanges tend to be nationalized. Once an exchange achieves critical mass in a particular market, traders naturally go to that exchange for liquidity. This network effect is difficult to overcome for new entrants.
Most of the CAPEX spent is of maintenance nature rather than growth, CME only spends ~6% of free cashflow (FCF) on CAPEX. This feature is similar to low marginal cost companies like Netflix, even banks like Goldman Sachs and Morgan Stanley have above 10% CAPEX to FCF ratios.
This means that revenues flow straight to the bottom line, even when there are declining fees per trade it has been more than offset by increases in volume. Also growth is not geographically limited.
CME has this unique position to monetize twice:
Transactions fees when trades occur
Data fees when passing information to distributors
Point #2 is an externality cost that is not factored into CME’s data production cost. A portion of the true cost of production is relegated downstream, this means CME effectively has negative cost of production.
FactSet
FactSet is like data factory ensuring high consistency and efficiency with minimal errors and rapid delivery. The reason why FactSet captures the least value is because error and efficiencies come at significant costs.
When FactSet collects data from various sources the chance of error is high, compounded by the need for data transformation and collation, this process opens up places for errors to happen.
To reduce errors FactSet has to incur operating expenses in form of labour and technology. Most of FactSet’s employees are in cheap labour countries:
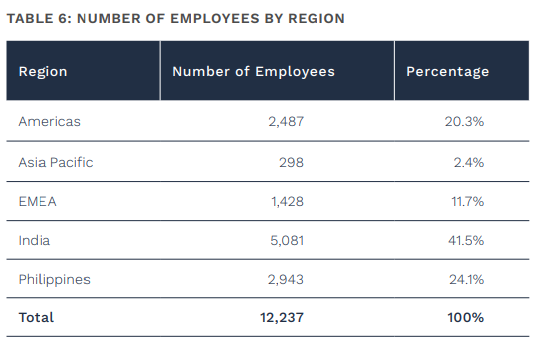
Although advancements in AI can help reduce costs, but this problem cannot be entirely eliminated. This does not mean that FactSet runs a lousy business model, consider the fact that 100% of revenues are subscription based with 95% retention rates. Unlike CME revenues which depend on trading volumes, FactSet continues to collect fees independent on volumes.
This predictable revenue profile and focus on cost optimization resulted in 44 years of consecutive revenue growth and 9% net income CAGR over 15 years.
MSCI
Information leaving the distribution factory ends up in the activation domain. MSCI takes these inputs and calculate indices, essentially it’s running an algorithm on any basket of stocks, over any time frame, only limited by the quantity of data inputs.
To perform this task MSCI has 3 factors of production: data, compute, labour.
Cost for data and compute on a per-unit basis has been declining since 70 years ago and the trend will logically continue. Only the labour cost is non-scalable and doesn’t have declining unit costs.
Fixed costs are incurred to create an index and drive initial adoption, then marginal costs are incurred only to calculate prices. Once an index achieves critical adoption, network effects come into play and licensing fees go straight to the bottom line.
Revenues for MSCI are de-risked in 2 ways:
Dependent on AUM size and not performance
Independent of customer type (active or passive investor doesn’t matter)
As AUM grows larger, the fixed costs are spread over a larger base and margins improve. Just look at this chart to know why the market assigns a premium valuation to MSCI:
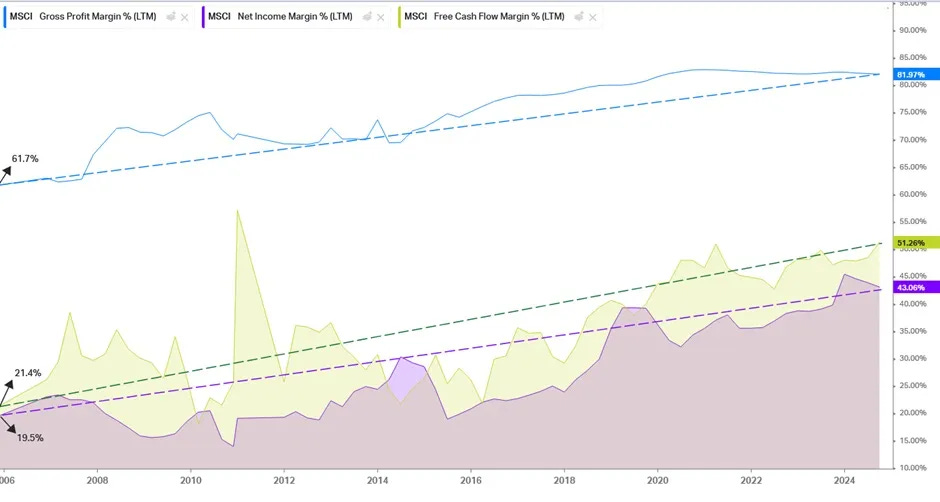
The 20% improvement in gross margins flowed down to a 20% improvement in net margins!
The Fed’s generous low interest rate environment contributed to the last 10 good years. But even in a recession, valuations are likely to be higher than companies in Production and Distribution stages. CME’s transactional business is reliant on volumes which disappear during a crash. FactSet high costs cannot be reduced quickly when data spending falls. In comparison, MSCI’s business model has more margin of safety.
However, notice that CME revenue per employee is much higher than MSCI. Labour is required to expand as MSCI operation scales in size because humans are needed to experiment on new index construction, maintain relationships with asset managers and buy-side analysts, implement AUM audit, negotiating fees etc.
On the other hand, CME simply collects trade processing fees and sells the data away, labour doesn’t have to scale with size.
Conclusion
In the financial data industry, if you own the means of production or activation, you can extract the most value. Otherwise, profits will be compressed from both sides.
Despite this fact, all 3 pure-play examples have outperformed the market by a large margin since IPO:
Bloomberg
Bloomberg is a worthy mention of a company that has vertically integrated all 3 stages in the value chain.
Stage 1: Production
The first resource Bloomberg attacked was bonds when the company launched in 1981 just as the global bond markets were booming.
Bloomberg responded with industry-leading real-time graphing and analytics tools to interpret the increasingly complex market. They focused heavily in bonds, and established themselves as the primary (and often the only) source of pricing, liquidity, and execution for various categories of bonds. They created a network of tools (ALLQ, DEBT, YAS) and connectivity. In a winner-take-all market, due to network effects, a trader would struggle to function without a Bloomberg Terminal (BT). Chat introduced in the early 2000s was a well-timed innovation as the market shifted from voice to chat-based execution.
Bloomberg also contested in FX markets which is mainly an interbank market. It won the Euromoney FX award in 2023 for the best FX market data provider. The rankings move around year on year but the data resources Bloomberg captured is already massive and valuable.
Beyond FX and bonds, through acquisitions over time Bloomberg has managed to build proprietary data in alternative classes (energy, commodities, consumer credit etc.).
Stage 2: Distribution
They also created Bloomberg News with a dedicated team of journalists and reporters working solely for Bloomberg. The company invested in infrastructure that optimized for delivering headlines to the world at scale. To further increase product stickiness, news are first distributed through BT. The cost of BT is $30k, so any customer who thinks that news will protect against a $30k loss should get a BT.
Stage 3: Activation
Bloomberg also collates financials of 85,000 companies across 115 countries with a history of up to 40 years, and it layers on a set of algorithms to derive financial metrics. It even offers proprietary analytics for scenario testing, risk analysis, back testing etc.
For example, in stock valuation, you can forecast variables and simulate as many scenarios as you like, each yielding a distribution of fair value.