
Principles: ROIC and Capital Allocation
The Capitalist’s Dilemma
Everyone knows about the book The Innovator’s Dilemma by Clayton Christensen.
There is another article he wrote, together with Derek Van Bever, titled The Capitalist’s Dilemma which is less known. This was in the June 2014 issue of Harvard Business Review.
It was written in context that post-GFC (2008), the US economy remained sluggish for a long time, producing disappointing growth and job numbers. The argument was that corporations, despite being flush with cash, failed to invest in innovation that would foster growth.
We quote an important section where the authors criticized financial metrics:
Because they were taught to believe that the efficiency of capital was a virtue, financiers began measuring profitability not as dollars, yen, or yuan, but as ratios like RONA (return on net assets), ROIC (return on invested capital), and IRR (internal rate of return). These ratios are simply fractions, comprising a numerator and a denominator, but they gave investors and managers twice the number of levers to pull to improve their measured performance.
To drive RONA or ROIC up, they could generate more profit to add to the numerator, of course. But if that seemed daunting, they could focus on reducing the denominator—outsourcing more, wiping more assets off the balance sheet. Either way, the ratio would improve. Similarly, they could increase IRR either by generating more profit to grow the numerator or by reducing the denominator—which is essentially the time required to get the return. If they invested only in projects that paid off quickly, then IRR would go up.
Why is this important?
The problem with these ratios is how they are understood and applied.
For management teams, it’s easy to feel pressured to maximize these ratios in the short term, leading to underinvestment in future growth. For investors, it’s easy to instantly, but mindlessly, look up any of these financial metrics online.
Definition of ROIC
On a conceptual level, ROIC is a measure of capital efficiency. It tells us whether management is deploying capital intelligently when compared against the opportunity cost.
If a business can produce more than $1 of market value by retaining $1 of unrestricted earnings, then it should invest that capital back into itself.
The only way to pass this $1 test is to have returns that are higher than opportunity cost.
This numerical example will make it clear:
To simplify, suppose that your business has no debt and requires no incremental investment. Therefore, net profit is equal to cashflows. You have this P&L in Year 1:
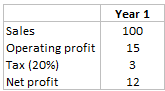
Assume your cost of capital is 8% and the business runs perpetually. Then, net present value for shareholders will be $150 (=12/0.08).
Now, you are have an opportunity to invest $15 of internally generated cash such that next year’s sales will grow by 10%. Operating margins and tax rates remain unchanged.
In Year 2, you’ll have this P&L:
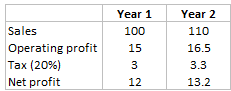
However, net present shareholder value didn’t improve…
(1) PV cashflow: 13.2/0.08 = $165
(2) Less investment outlay: $165 – $15 = $150
Why so?
The extra $1.2 cashflow (or net profit) when discounted back at 8% is exactly $15 (1.2/0.08). Shareholder value doesn’t change when PV of incremental cashflow is equal to PV of investment.
All businesses must continuously make capital allocation decisions to maximize returns for shareholders. Whether it’s machinery, equipment, property, securities, or R&D, the business must make comparisons of the returns it can generate before allocating its capital.
ROIC is the aggregate return measure of all the investments the company has made. As a company announces new investments, the market judges whether those investments add or destroy value. If the company is believed to generate returns over its cost of capital, it’s priced at a premium to book value. Conversely, when it continuously makes investments that earn returns below the cost of capital, it destroys value and deserves a discount to book value.
Components of ROIC
Like any ratio, ROIC has a numerator and denominator:
ROIC = NOPAT / INVESTED CAPITAL
The first thing to notice is that both numbers cannot be directly lifted off the face of reported financials. The analyst has to use sound judgment, which is where fundamental analysis comes into play.
NOPAT
The numerator is Net Operating Profit After Tax (NOPAT) rather than Net Income. NOPAT is a company’s potential cash earnings on an unlevered basis. Whether a company is highly levered or debt free has no impact to NOPAT. In other words, it measures profitability regardless of how the company is financed.
NOPAT is an important finance concept. It’s the number from which we subtract investments (changes in working capital, CAPEX, M&A) to estimate free cashflow.
Invested Capital
The denominator is invested capital. It’s the net assets required to run operations. Alternatively, it’s the financing a company’s creditors and shareholders need to supply to fund these net assets. The former is called the operating approach and the latter the financing approach. Both ways arrive at the same number due to double-entry book-keeping.
Note that invested capital is based on book value rather than market value. The purpose is to calculate the returns earned on existing assets, assuming book value is an effective measure.
If we use market values, then it means that we reflect the market’s perception of the assets’ earning power. Doing this will just yield a calculation equal to the market’s cost of capital.
Why ROIC is Important
The ratio itself is only important because of the underlying importance of capital allocation.
Think about how an investor “generates alpha”… it only happens when the returns exceed a hurdle rate (or opportunity cost). Similarly, a business owner is just like an investor seeking to allocate capital.
All roads to management assessment come from capital allocation. Think about placing employees to the right positions, budgeting expenses into the right areas, and doing M&A… all these activities are capital allocation.
But the truth is that few companies in the world have excellent capital allocators at the helm. The problem is that how they perform is rarely immediate and obvious.
Most companies are led by skilled managers who can generate decent profits, keeping shareholders happy as long as reinvesting in the business pays off. But as cash builds up and managers start exploring diversification, M&A, new markets, pay dividends, or stock buybacks… their job becomes more complex.
To illustrate the significance; when a CEO runs a company for 10 years and reinvests 10% of the company’s net worth via earnings each year, they’ll end up allocating 60% of the company’s initial capital during their tenure!
ROIC and its components do a better job judging historical capital allocation than any other metric. And ROIC is linked with the baseline growth (g) of a business:
Reinvestment Rate = ROIC / g
From the above relationship, it means that growth is never free. To grow, every business has to reinvest.
A business earning an ROIC of 10%, which wishes to grow 10%, has to reinvest 100% of every dollar it earns. It won’t have any excess cash to repurchase stock, pay dividends, or acquire other companies.
The implication is when a business reinvests perpetually at a given ROIC, the returns an investor will converge to the ROIC as time goes to infinity.
Misconceptions of ROIC
Bad Understanding, Bad Calculation
If you go online and pull up ROIC figures of a company, every website will give a different answer. There is no standardized way to calculate it, and judgment is needed to get from accounting to economic reality.
Here are some of those nuances…
Expenses: Some expenses should be amortized depending on the nature of the business, for example, R&D or marketing spend have a useful life but are expensed off in one year.
Taxes: Since NOPAT assumes no leverage, we must remove the tax benefit from paying debt interest, also known as tax shield.
Unusual items: For example, asset write downs distort ROIC. But judgment is needed if the asset has become obsolete for the business then it doesn’t make sense to lower the ROIC by including it in the capital base.
Excess cash: Not all cash should be removed from invested capital because some level of “operating cash” is needed to run the business.
Goodwill: This is not included in invested capital on the assumption that it’s paid for growth assets. However, some overpayment may consider expected synergies in the combination. Or if the company is a serial acquirer then it makes sense to include all goodwill.
ROIC Spread isn’t Everything
Two companies that generate the same spread between ROIC and cost of capital will not have the same value if one of them can deploy more capital.
A company can show high ROIC today by refusing to make the necessary investments required to maintain its competitive advantage. Or, it can invest to strengthen it’s position, showing low ROIC today. There’s an obvious long-run distinction here.
Finance and competitive strategy are interlinked. A thoughtful valuation goes beyond just selecting the company with the highest ROIC spread, it requires an understanding of industry structure and competitive advantages.
Conclusion
The return a company makes on capital versus the opportunity cost is the core of value creation. If we agree on this, then capital allocation skills are top priority when evaluating management teams.