
PGR: Progressive (8)
Q1 2026 Update
PGR is facing headwinds after coming out of a hard insurance market where everyone was enjoying a few years of supernormal profits. Naturally, competition came in and with Florida passing extensive tort reforms, we are seeing average rate decreases of -8% across the top 5 auto insurers. Interested readers can see here for more details.
To set the short term expectation upfront: This year we are very likely to see margins compress. But this is cyclical and not structural, which gives long term investors a chance to buy shares.
Last year, in 2025, PGR recorded 87% combined ratio — such profitability is not sustainable, especially in a commoditized product like auto insurance.
We see the effects in Q1 2026, policy-in-force (PIF) for personal lines (auto+property) increased +9%, much lower than +18% last year. We actually want to see slower growth in a soft market, this is a sign of being a disciplined underwriter — don’t take business if rates are inadequate.
Here are the key YOY comparisons for Q1 2026:
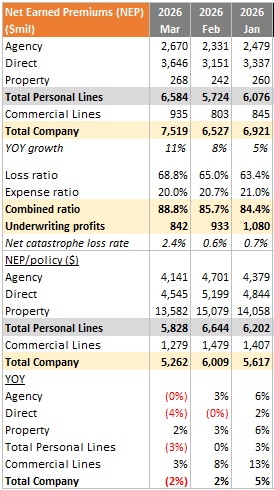
Combined ratio (COR) still strong at 86.4%. Both personal and commercial lines were profitable at 86% and 89% respectively.
Underwriting profits +5% from $2.7b to $2.85b.
Net earned premiums (NEP) +8% from $19.4b to $21b.
Investment income +13% from $814m to $917m.
PIF grew +9% to 3.3 million, adding nearly 1 million policies in Q1 alone.
Market Share
PGR has a profitability target of COR 96%, but it is still reporting extremely good margins. So they will continue to spend on marketing to grow PIF; advertising spend of $1.5b in Q1 2026 was +20% YOY.
As a result, PGR gained 1.9 percentage points and moved up to 18.5% market share. They are right behind State Farm’s 18.6% share. There’s no doubt PGR will soon be America’s largest auto insurer.
Did you know that it took PGR 84 years to get to 15.2% market share and just 2 years to achieve 18.6% (amazing)?
The impact on expense ratio caused by advertising spend was partially offset by higher NEP, increasing the expense ratio by 0.7%. PGR will continue to spend on marketing for growth as long as they are below the full year 96% COR target.
Affordability & Uncertainties
New policyholders are expensive to capture, but their lifetime acquisition cost decreases the longer they stay with PGR. So, retention is very important and PGR continues to bundle auto & property insurance together to support retention.
Affordability is an issue for consumers lately. The proportion of uninsured motorists have increased, this is a problem that came with COVID through inflation, higher repair/medical costs. In fact, as vehicles become more fuel efficient, the largest cost item could become insurance premiums.
For auto and property insurance, on TTM basis, policy life expectancy (PLE) was down -8% YOY.
For commercial auto, on TTM basis, PLE was up +5% YOY.
The uncertainties are in fuel prices from the recent Iran war. The impact of higher fuel prices on personal auto claims frequency is difficult to predict, although intuition tells us that when fuel is more expensive, people take fewer discretionary trips, and accident frequency should decrease.
On the severity side, higher energy costs generally contribute to inflationary pressures. But this also takes time to make it through the supply chain.
PGR is not new to these shocks. In recent years, they experienced higher used vehicle prices in 2021 from post-COVID supply chain issues, social inflation, and President Trump’s tariffs in 2025.
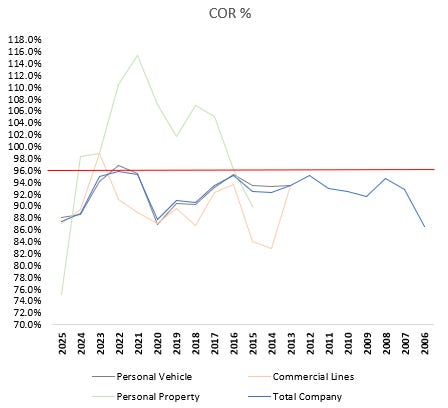
We just have to look at the amazing long term record of COR for the last 2 decades. Total company COR never exceeded 96%.
Other Notes
On price per policy, we continue to see weakness as expected in a soft market:
On competition, it’s interesting to see how strong PGR is when it comes to pricing risk:
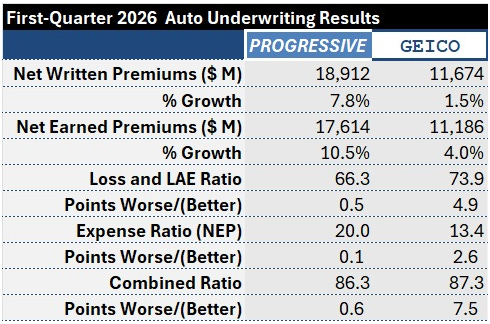
Although GEICO is the lowest cost auto insurer, PGR has beat GEICO in loss ratios by 7.6 percentage points! NEP grew by +10.5% for PGR, more than twice the pace versus GEICO, while achieving a lower combined ratio.
Valuation
PGR market cap is currently $113.4b ($192/share), and management has spent $435m on shares repurchases in Q1 alone. This amount is almost equal to the total past 3 years of repurchases!
Below is the framework on how PGR returns cash to shareholders:
Return free cash flows to shareholders through dividends.
Repurchase shares to offset stock based compensation.
Repurchase shares when PGR stock is cheap.
We can show this from the cumulative cash spent on dividends and repurchases. For the past 10 years, 96% of FCFE was distributed to shareholders, most of it via dividends:
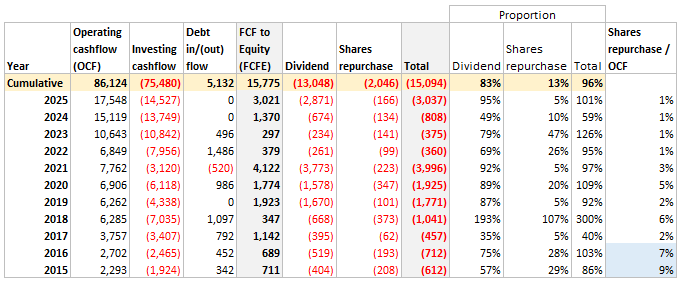
Look at the last column: Share repurchases as % of OCF is actually very low except for 2015/16 (blue highlights).
Remember this table, we will come back to it!
This is important, as we mentioned, this quarter $435m was deployed to repurchase 2.3 million shares at average price of $204.9/share (~6% higher than current $192).
Now, this $435m is 10% of OCF… clearly a large amount in just one quarter.
What’s so compelling about the valuation?
This table shows our estimate of intrinsic value:
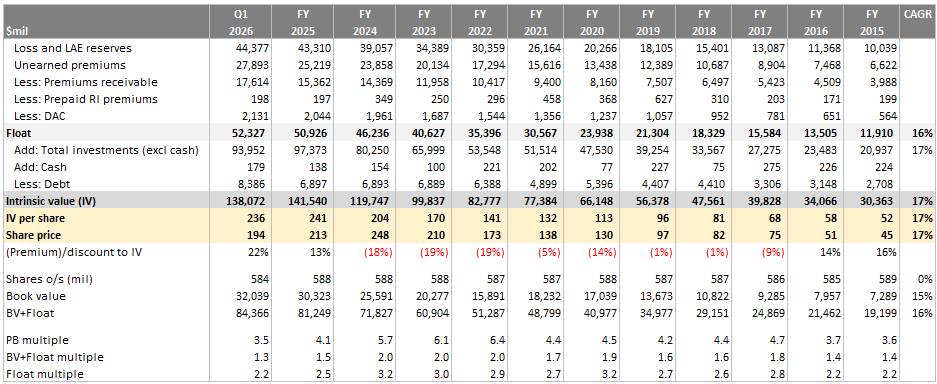
We think that PGR’s intrinsic value is the sum of insurance float, total investments, and net debt. Why?
Float is policyholders’ money and is a liability in accounting terms. But economically, PGR receives float at a negative cost, because underwriting is consistently profitable. If float is earned in a profitable manner, then incoming premiums are more than enough to pay outgoing claims. The insurance float actually behaves like permanent capital, instead of a liability.
Float is only a liability if PGR stops growing or incurs underwriting losses. In fact, even in a situation of losses, as long as the cost of float is lower than Treasuries, it is still a “cheaper” form of leverage. That’s why the industry on average barely makes any underwriting profits, the investment income from float makes up for it.
Furthermore, the short tail nature of auto insurance gives us confidence that mispricing risk is not as dangerous compared to insurers who write long tail risks. Since most claims settle by year 3, any inadequate pricing can be quickly discovered and adjusted.Investment assets generate investment income. Yield comes mainly from $88b bonds, $2.1b short term investments, and $4.2b equities. The heavy allocation to Treasuries & corporate bonds is the right mix because PGR writes short tail insurance, their assets must match short duration liabilities. 64% of bonds mature under 5 years, 36% mature between 5 to 10 years. Equities cost basis was $1.1b against fair value of $4.2b.
Notice that most of the time the stock trades at a premium — no surprises, PGR is a wonderful business and everyone knows that. However, in 2015/16 the stock was undervalued… recall how management responded?
Yes, they spent 7—9% of operating cashflows on repurchases. Subsequently, when the stock became overvalued, they only spent average of 2%. This shows that PGR is opportunistic in shares repurchases.
Today, the stock is once again undervalued and PGR has deployed 10% of operating cashflows to repurchase at $204.9/share. In any case, the book and float price multiples are at decade low levels.
Management Incentives
The big assumption why we can treat float like permanent capital is that PGR must grow profitably.
For insurers, it's easy to grow without profits — just offer silly prices and volumes will go up.
It's also easy to be profitable without growing — just stop marketing and have no salesforce.
For float to be treated as capital, both growth and profitability must be achieved.
It all comes down to incentives. Because how employees are compensated will drive their behaviour.
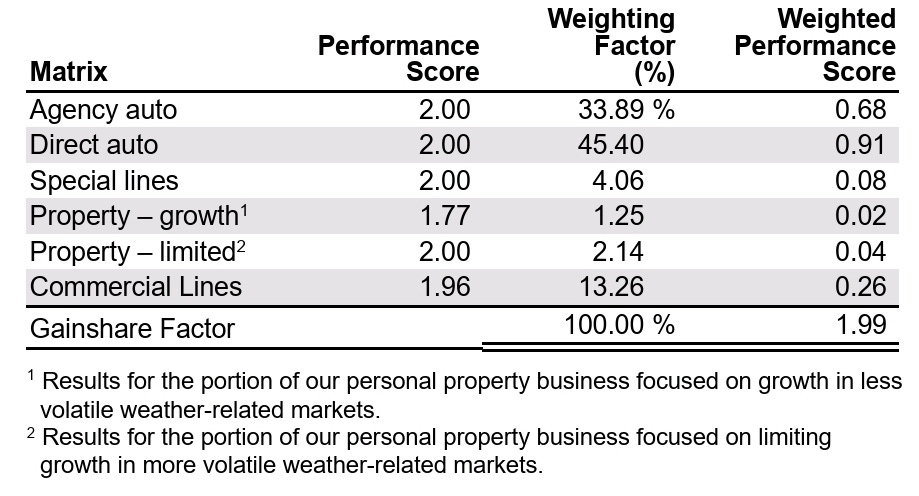
PGR has a long standing incentive plan called Gainshare. It has been in existence for 33 years. Gainshare evaluates the growth and profitability of each of their businesses separately and determine a score between zero and 2.00 for each business.
The individual scores are calculated based on a matrix that was approved by the committee at the beginning of the year that contemplated several profit and growth scenarios.
Each matrix was built by anchoring the 1.00 score at the established profitability target for the line of business, along with an aggressive growth goal when compared to historical industry growth rates.
Each possible combination of growth and profitability would produce a score, and a score at or near 1.00 could be earned with a variety of growth and profitability combinations. If growth was below expectations, a 1.00 could still be achieved if profitability increased and, likewise, a moderate decrease in profitability could be offset by higher growth to generate a score around 1.00.
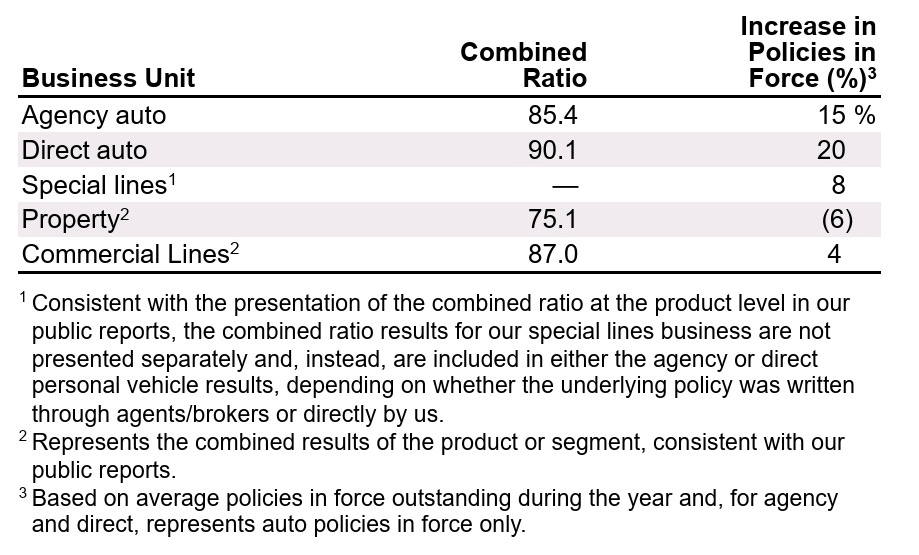
Below is the 2025 results and Gainshare scores:
This is a summary table of the elements that determine compensation for the management team:
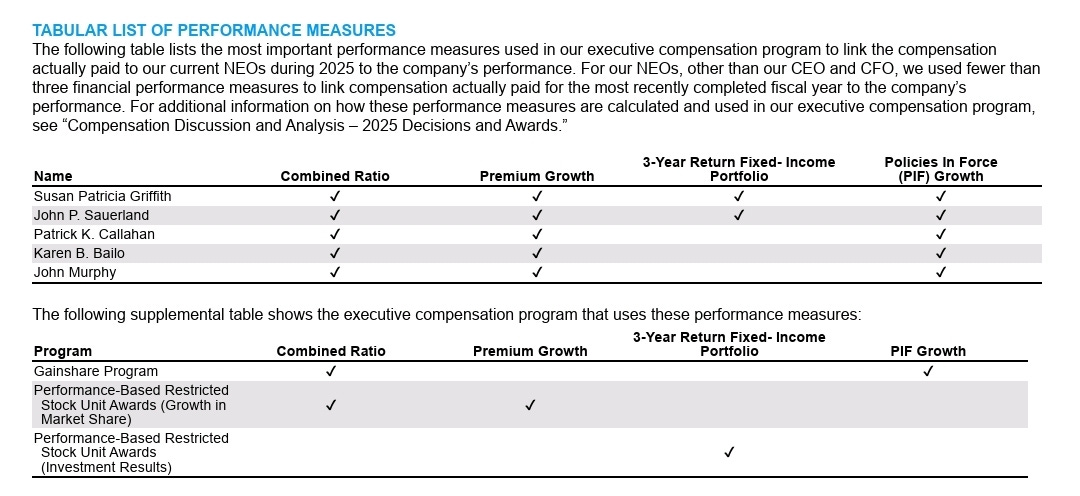
Performance stock units (PSU) compensation vest on 2 conditions:
Comparative growth against industry over 3 years.
COR must be better than 96%, otherwise restricted vesting.
CEO Susan Griffith owns 599,411 shares worth over $116m (>100x her base salary).
All executive members have at least 6x base salary in PGR shares.
Conclusion
Consider this statistic: If you had seen this valuation table and bought PGR in 2015 for $26.3b ($45/share), your price CAGR would have been +17% excluding $21.6b of cumulative pre-tax dividends. Taking tax into account, the dividends alone would’ve covered 57% of your cost basis!
During then PGR market share was just 8.9%… the wonders of compounding at work.
Anyways, we think that the stock is undervalued and will add to our position.