
PGR: Progressive (6)
Q3 2025 Update
This year PGR stock price fell -5.8% despite:
Growing total policies-in-force by +12% YOY.
Growing NEP (net earned premiums) by +17% YOY.
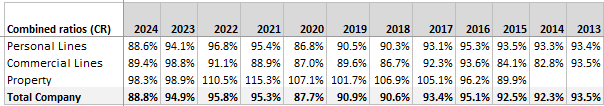
Underwriting at combined ratios of 87.1% for Personal Lines; 87.8% for Commercial Lines. Overall total company reported 87.3%.
PYD (prior year development) releases of $1.1b.
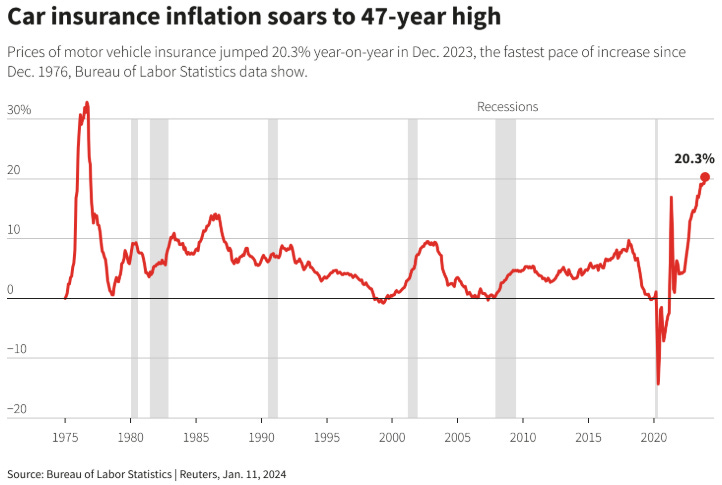
The auto insurance industry is facing high premium rates as major insurers are re-pricing in response to higher repair costs caused by inflation and tariffs. PGR played it well, by raising premiums before inflation really took off, so it was able to protect profits as claims cost rose. Once prices in the broader market caught up, PGR was under less pressure to raise prices again.
This strategy has earned PGR market share over State Farm and GEICO, becoming the second largest auto insurer at the time of historic inflation (2022/23 saw car insurance prices rose at the quickest rate since 1970s).
Today, PGR doesn’t have to hike prices, putting it in a position to protect those market share gains against competitors who were less capable of pricing risks. This is the core of what PGR does well: matching price to risk.
As a result, the average 9-month NEP per policy for their auto insurance segment (Personal Lines) was $5,784 compared to $5,933 last year.
In September 2025, there was an increase in both expense and loss ratio due to Florida policyholder credits. Since the state of Florida issued reforms in 2023, they have ruled that insurers cannot earn more than the statutory profit limit on personal auto insurance over any 3-year calendar period. PGR is very profitable in Florida, it’s also the largest market (13.7% of total premiums). So, they recorded a $950m liability that represents their current estimate of the excess profit ending this year. This excess will be returned to policyholders.
With 2.7 million Florida policyholders, this is ~$350 rebate per person.
So with all these good developments, is the market mispricing PGR stock?
Instead of directly answering the question, we love to go on an education tour…
Understanding Insurance Float
Float is commonly understood as a pool of funds that an insurer holds between receiving premiums and paying claims. Between these two points in time, the insurer invests the float to earn some income.
This float comes at a cost, but it has 2 important characteristics:
If the insurer doesn’t shrink, float is permanent capital that need not be repaid.
If underwriting is consistently profitable, the cost of float can be negative, meaning that policyholders pay the insurer to hold their money.
Using PGR as an example, to estimate float from the balance sheet, we add up policyholders’ money and less out amounts that don’t belong to them:
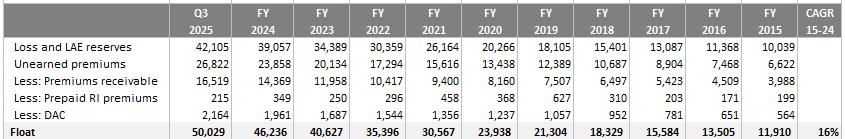
Float is costly if PGR makes underwriting losses and it carries no cost if underwriting is breakeven. As we know, PGR has been making underwriting profits every year since 1987! The last 10 years averaged at 93.7% combined ratio, or a 6.3% underwriting profit margin.
This means that PGR was paid, on average, 6.3% to hold onto and invest the float. Obviously, this type of leverage is superior to any form of debt or equity financing.
Accounting vs. Economic Reality
Insurance float is a liability on the balance sheet. Accountants would be correct to think about it as a liability if PGR is closing shop, because ultimately they will have to pay off claims from the float.
But PGR is not closing shop, in fact it’s thriving with underwriting profits year after year, and thus growing its float over time. Economically, PGR float has equity-like characteristics.
When PGR is underwriting profitably, new policyholders premiums are more than sufficient to fund existing pool of policyholders claims. So the investment balances generated by float “liability” is actually a form of permanent capital; even better than dilutive equity financing!
One important takeaway: A dollar of float has more value than a dollar of equity. Since float has negative-cost to PGR, it has in effect allowed PGR to own more assets than its capital would allow.
Better yet, since their float is growing, it means that the value of float must be worth more than its face value.
Valuation #1: Float
The key to understanding how to value float goes back to the nature of the capital structure of an insurer. It is wrong to discount the expected cash that the float produces by the WACC (weighted average cost of capital). Float is policyholders’ money, it has nothing to do with debt or equity, why then should it be subject to WACC?
This WACC, or any discount rate, will give an absurd result. For example, if you have $100 of float that produces a perpetual after-tax cashflow of $5. Suppose that your discount rate is 10%, then your PV of float is $50. Clearly, this violates the idea that the value of float is more than its face value.
Now, if you insist on finding the PV of float by discounting, you may think of adjusting WACC like this:
WACC(adj) = a*[cost of equity] + b*[cost of debt]*[1-t] + c*[cost of float]
where:
a+b+c = 1
t = tax rate
If the cost of float is zero (underwriting breakeven), then WACC becomes like the traditional formula, except that the weights (a,b) are smaller. So WACC(adj) will be a smaller value.
However, this still brings up some problems that make the present value approach unreliable:
If the insurer is very profitable, cost of float can be negative such that WACC(adj) becomes negative. This doesn’t make sense.
What is the cost of equity actually? If you go down the academic route of CAPM, soon you will run into a bunch of assumptions that don’t work in real life.
There is a sensible, logical and easier way to value PGR without going through the unreliable hoops of discounting.
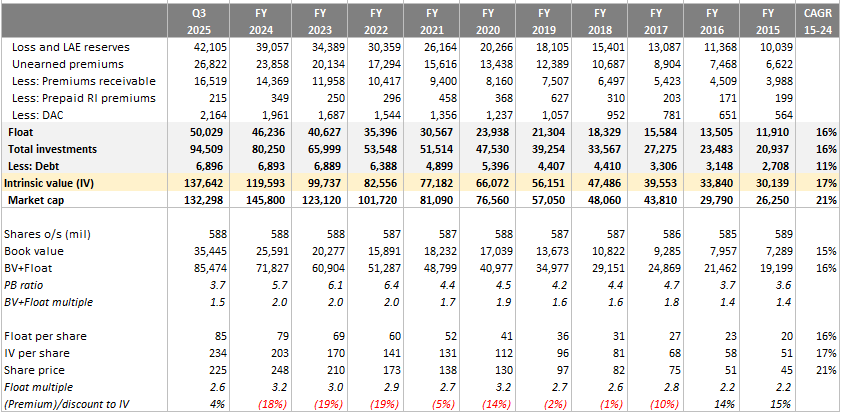
The intrinsic value of PGR can be thought of as the float and total shareholders’ investments, less debt. Economically speaking, that’s the total capital base that runs the insurance operations, and so derives the value of the company.
Shareholders’ investments are investments attributable to shareholders. In life insurance companies, the investments don’t 100% belong to shareholders, some of it belong to policyholders because life policies have investment return built into the product. PGR doesn’t have life/health policies so we take all investments as they belong to shareholders.
As of Q3 2025, out of the $94.5b of investments, $90b is in fixed maturities and $1.5b in short-term Treasuries. About 70% of maturities are below 5 years. So their cost basis and fair value are almost equal.
The part we need to be careful is the $4.5b mark-to-market valuation of equities. Currently, we are in a richly-valued stock market environment, and so reported values can be overstated. By the way, the cost basis on common equities is only $808m, while the market value is $4,047m! PGR doesn’t have to pay deferred taxes on these unrealized gains, this is like a interest-free “loan” from the government.
Since 2015, float per share grew at +15.5% CAGR while share price grew at +17.6%. The difference is a slightly higher float multiple.
Comparing our intrinsic value to market cap shows a small discount, likely fairly valued.
We can also look at the rate of change. Float is the most important factor we want to track against the growth in market cap. Currently, we have market cap slightly outpacing float growth over the last decade, suggesting that the stock is again fairly valued.
Valuation #2: EPS Method
Another way to approach this is to estimate the forward earnings-per-share (EPS) for next year and see what’s the forward PE. Below is our assumptions:
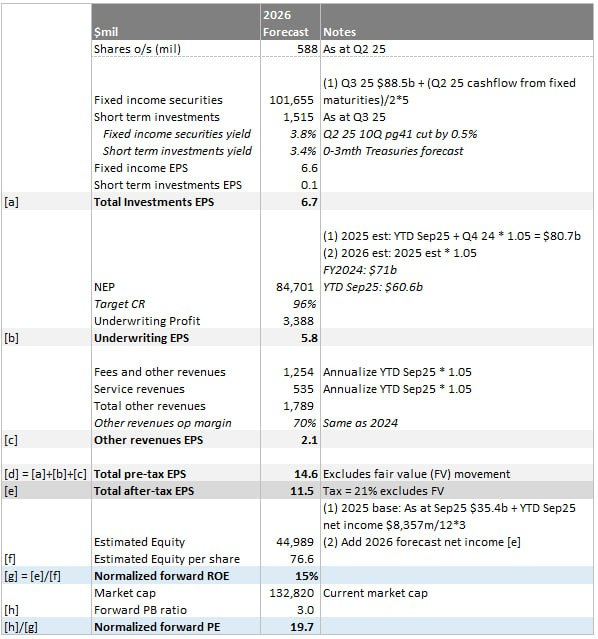
Note that we normalized combined ratio to 96%. In actuals, PGR produced 94% on average.
This gives us normalized 1-year forward PE of 20x on a business with 15% ROE. This looks like a fair price.
ROE sanity check: Last year, net written premium to equity ratio was 2.9x. At 4% underwriting margin, this is ~12% returns. Add 4% yield on fixed income portfolio, reasonable for ROE ~16%.
Valuation #3: PV of Float
Let’s say you insist to PV the cashflows generated by float, we can do a reverse DCF and see what kind of growth profile is needed to solve for today’s market cap.
First, PGR funds all its fixed income investments ($90b) with float ($50b) and equity capital ($35b). So if we take the market cap less equity capital, the remainder $97b represents PV of float. This is the figure we want to back-solve in the DCF.
Second, what is an appropriate discount rate? We think that PGR float behaves like permanent capital, and is essentially “risk-free” in the sense that it doesn’t have to be repaid to policyholders. So the equivalent discount rate could be short-term Treasuries, let’s take 3%.
We can assume such a growth profile to solve for the $97b (discount rate 3%):
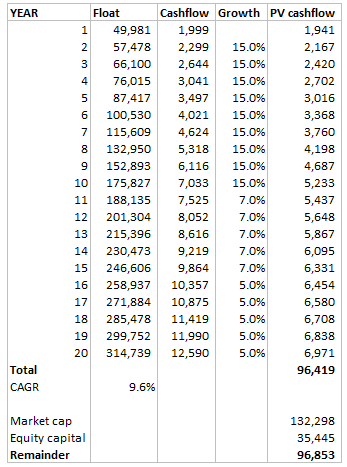
The driver for float growth is linked to net earned premiums (NEP). For the last 10 years, float and NEP both grew at CAGR +15%. This makes sense because the premiums earned upfront goes into the float and gets invested.
The implicit assumption in the DCF is that the float, and by extension, the NEP will compound at +9.6% for the next 20 years. For a dominant player like PGR, we don’t think it’s a far fetched goal, but it’s also not a very easy hurdle. A few things must go right:
Drivers population continues to grow.
PGR is able to raise premiums with inflation.
PGR continues to take market share from State Farm.
This leads us to think the stock is probably fairly valued now. We will add on to our existing position at $132.3b market cap.
What Could Go Wrong?
Underwriting Discipline
Unprofitable growth is the deadliest poison for insurance companies. Due to the leveraged nature of float, insurers typically write premiums at a multiple of shareholders equity, so a $1 underwriting loss reduces equity by >$1. It is very easy and tempting for management to boost top line sales and bottom line profits to impress Wall Street in the short run. They just have to offer silly prices!
It’s good to know that Tricia Griffith (CEO 2016 – present) was from the claims department rather than from sales.
Apart from reporting every month their financials by channels, they actually brought their pricing actuaries to give a technical presentation on how they price risk in the Q2 earnings call. This type of communication and transparency is very rare.
The loss development triangle shows cumulative deficit reserves of -$991m (-2.9% of original reserves). The deficiencies come from accident years 2021/22 where inflation was unexpected and caused higher liability and damage auto claims cost:
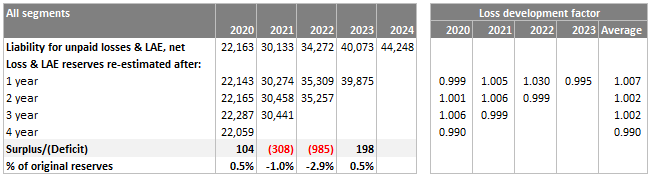
Loss development factor historically approaches 1 as time passes since most of the claims are paid by year 3. In other words, we can expect 2021/22 deficit to be almost unchanged going forward.
Pricing have increased after 2022 and we start to see surplus in reserving, which is a good sign, generally PGR is very accurate in it’s pricing.
Float Shrinks
What if PGR stops growing float and loses market share?
We find this extremely unlikely because PGR is the pioneer of using technology and data within the industry. In 1995, it was the first insurer to introduce buying insurance online. In the early 2000s, PGR launched usage based insurance (UBI), where they placed a device in cars to monitor driving habits, resulting in better pricing. These days, technology has improved and people are using smartphone apps.
Furthermore, State Farm is still the largest (18%) US auto insurer despite losing share every year to PGR and GEICO. In terms of profitability, State Farm is horrible:
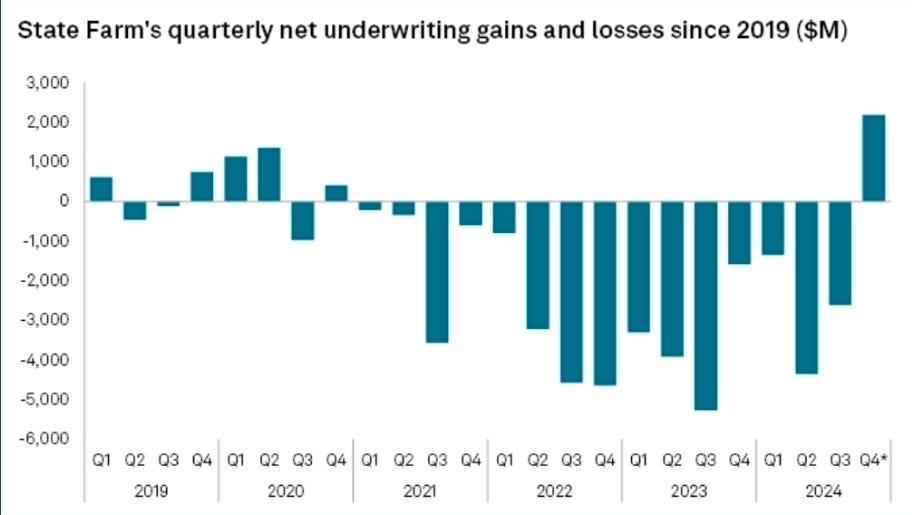
There’s more market share to win from State Farm. The reinvestment runway is long.
On the flip side of UBI: PGR Snapshot (voluntary program) is designed to measure “bad driving behavior” such as: hard brakes/acceleration, driving at night, number of trips, duration, hard corners, top speed… This might actually wrongly fault the driver due to externalities he can’t control, which increases premiums and makes customers switch insurers.
Duration Matching
Yield chasing is a thing we watch out for. PGR claims are short tail in nature, so any given claim is largely paid within 3-5 years. If fixed income assets are long dated, they run into interest rate and liability mismatch risk. For decades, PGR has been very disciplined in duration matching, even during the long periods of low yields post 2008 GFC.
If interest rates go to zero again, the value of float will certainly diminish. But it will always be value accretive as long as float grows from profitable underwriting. We need to be comfortable investing in PGR for the very long run through such cycles.
Combined Ratio History
GEICO combined ratio since 2000, although mostly profitable, there are still some years that float was costly. This is not really a problem because when compared to raising debt/equity, insurance float is still cheaper.
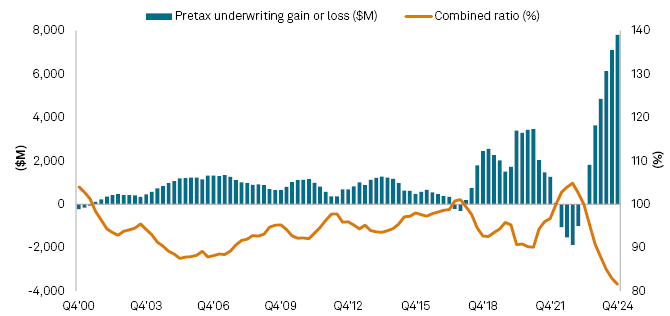
Take a look at PGR combined ratio against the industry. Very impressive:
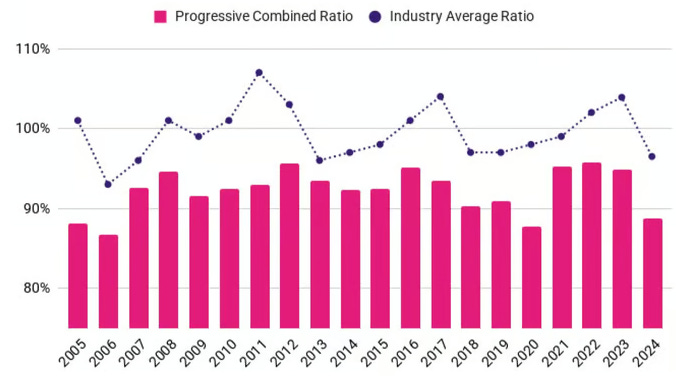
The combined ratio for the homeowners’ portfolio has went below 100% since 2023. PGR began going into the homeowners’ insurance industry in 2015. They did it by buying ARX Holding, the parent company of the former American Strategic Insurance in St. Petersburg.
Initial purchase of a 67% stake in late 2014 for $875m. Followed by the acquisition of the remaining stake in early 2015.
In 2020, PGR announced a deal to buy out the remaining shareholders for an additional $242m, bringing the total deal to ~$1.4b.
The Robinsons
If you listen to PGR earning calls, you will hear them talk about “The Robinsons”. It is a nickname for what management calls as the segment that includes households who own a home and a car and place the insurance on both with the same insurer as a bundle.
A bundled household represent the ideal scenario for lifetime value in the eyes of big insurers. By bundling auto and home policies for these families, PGR unlock retention, advocacy, and steady growth, while only bearing the expense of taking one onboarding process.
Data shows that the Robinsons renewal rate with their current insurance provider is 53%, significantly higher than any other customer segment.
This group also has the longest tenure with their current insurer, with 45% of Robinsons having been with their insurance provider for 11 years or more. Additionally, 41% of Robinsons select their insurer in order to bundle home and auto policies, creating an ideal scenario for insurers.
PGR aims to grow in this segment. Already in 2022, they have emphasized this market segment and designed its quoting system for these bundles, in order to attract Robinsons and make their shopping and signing up experience as good as possible.
The Robinsons make up almost half of PGR direct written premiums currently.