PGR: Progressive (2)
Update YTD May 2024 results: Policies in Force & Market Share
We have wrote about PGR in the past here. We do own PGR at average cost basis of $117 per share.
At the start of 2023, PGR pursued a growth strategy. Policies-in-force (PIF) grew by 6% between January (27,824k) and May (29,506k) but growth came with a rising combined ratio which reached 104.9% in June. This caused management to reduce growth for the rest of 2023. PIF increased by only 0.4% between June and December as the combined ratio improved considerably, reaching 83.4% in December.
The main challenge in the insurance industry is to balance gains in market share and achieving acceptable profitability. Despite the error in 2023, PGR has successfully gained market share over its competitor GEICO. It was promoted to #2 in auto insurance and GEICO demoted to #3. Full year 2023 combined ratio was 94.9% and this is below PGR’s target of 96%.
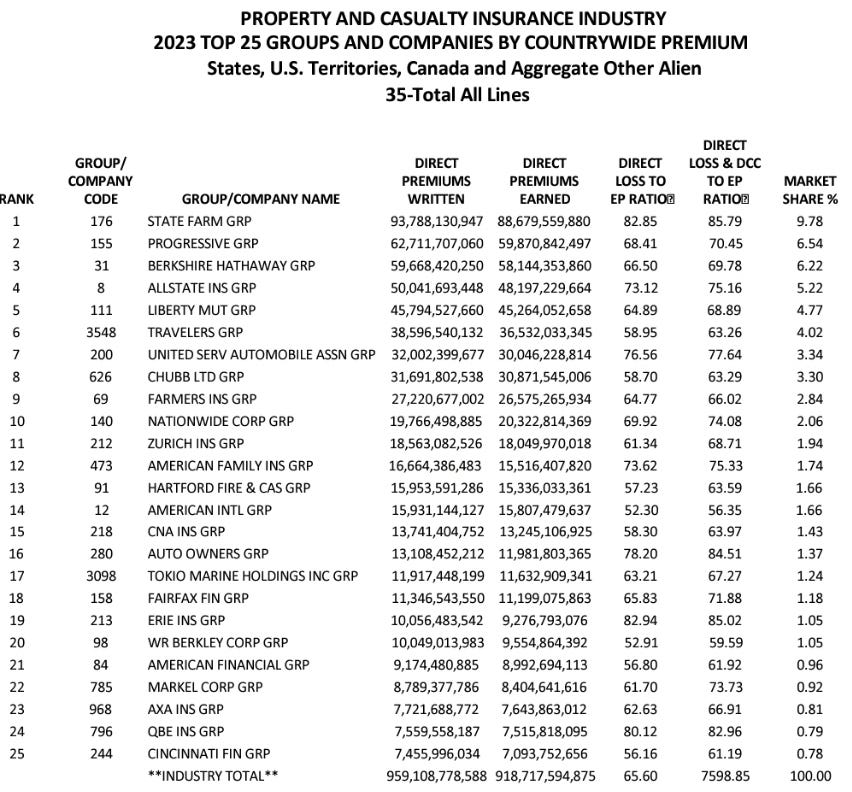
Below is the P&C market share by premiums of US insurers, it is quite fragmented with lots of room for growth:
Here is the passenger auto insurance market share, the top 3 companies (State Farm, PGR, GEICO) makes up 46% of market:
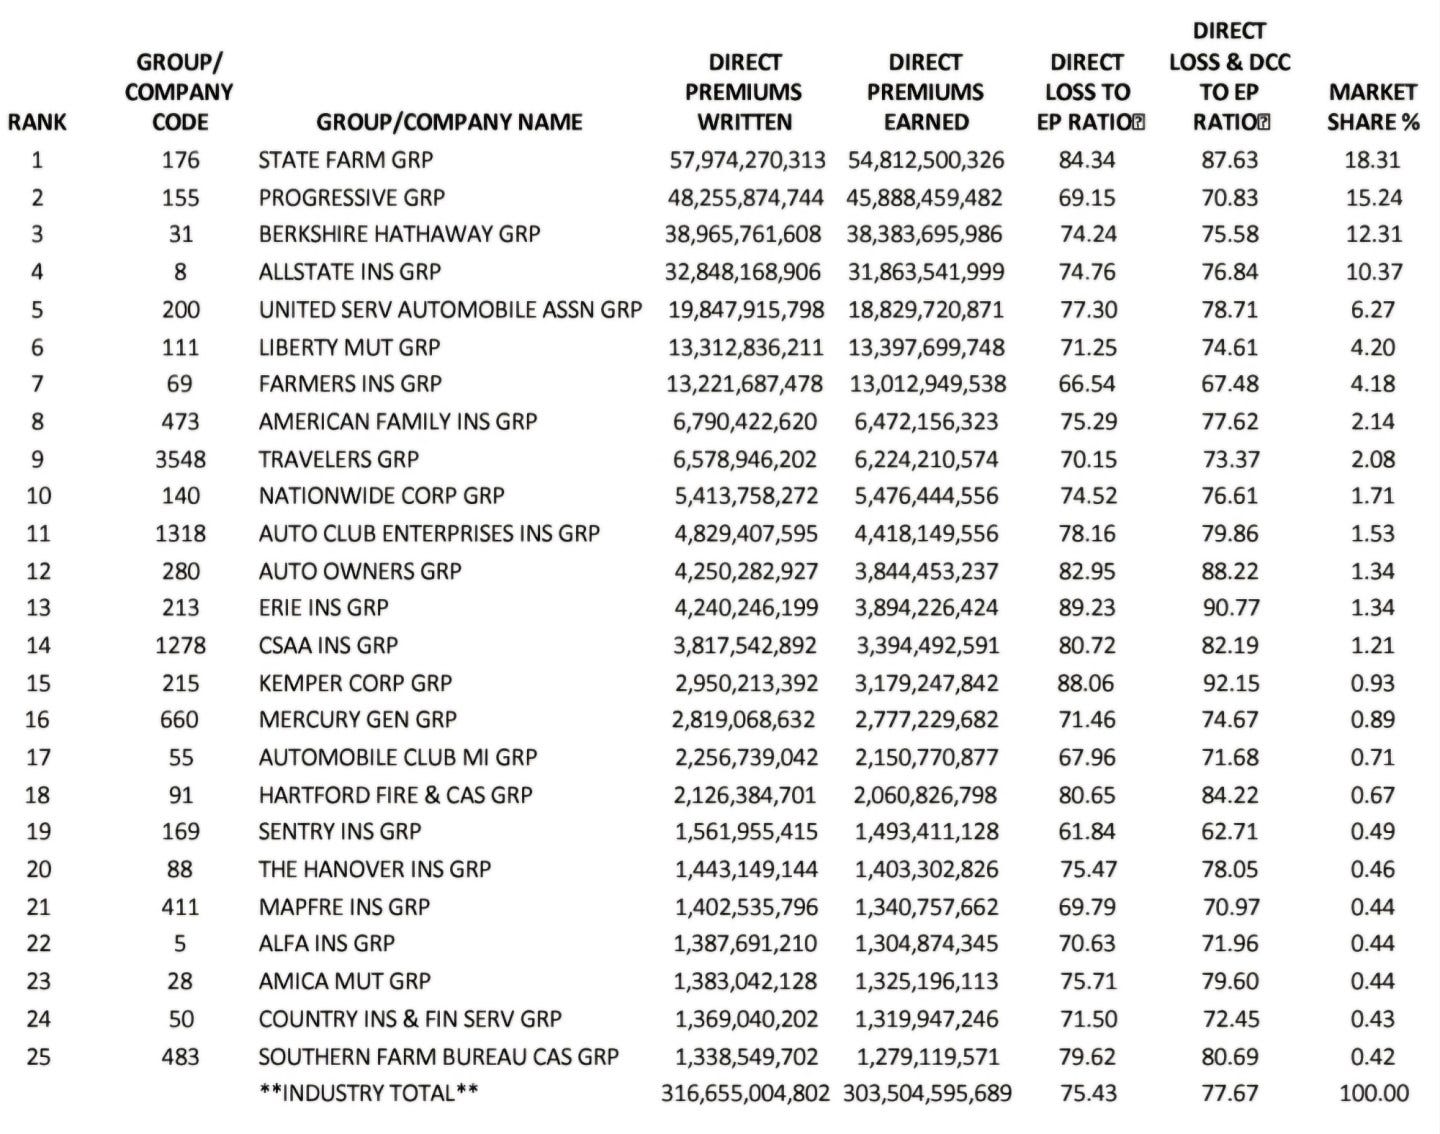
Source: NAIC data
Insurance, in general, has been a major pain for consumers recently, as inflation caused premiums to increase to offset higher claims costs. This causes the consumer to be more willing to do some comparison shopping and insurers have increased their advertising expenses to grab market share.
Total addressable market (TAM) growth stats in terms of earned premiums:
1. P&C industry’s 2022: $845b, 2023: $919b (+8.7%).
2. Passenger auto 2022: $271b, 2023: $303b (+11.8%).
If PIF grows faster than the addressable market (ignoring effects of price increment), PGR’s market share will increase, but this is only good if underwriting profits are maintained. We know that new business is less profitable than renewals because there is upfront acquisition and underwriting cost involved in on-boarding a new policyholder.
PGR’s disclosure is super helpful to the analyst, they provide monthly data on PIF, premiums, combined ratios:
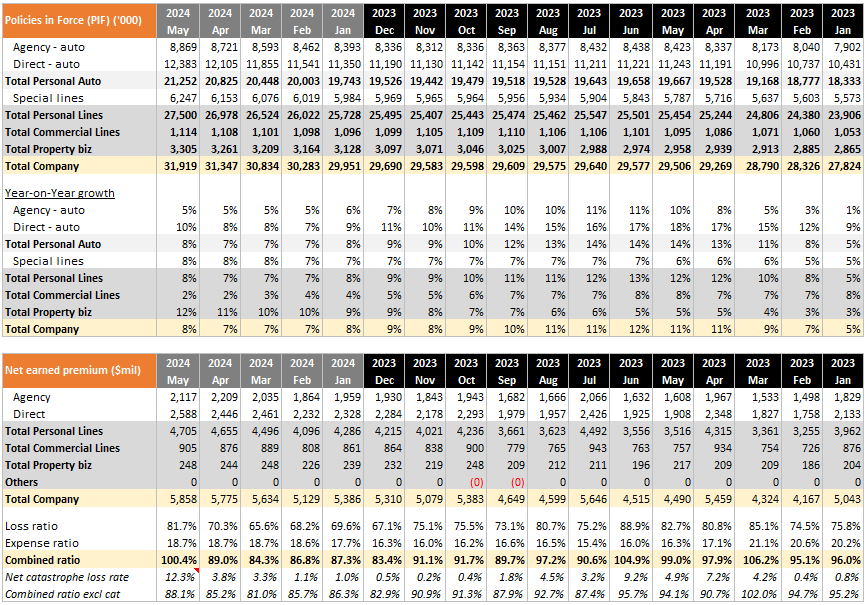
PIF grew YOY +8% as at May 2024, at slower growth rate than last year.
Combined ratios have been good since Jan 2024, except for the month of May where there were $722m of net catastrophe losses, causing 12.3% of loss ratio, related to severe storms primarily in Texas and the Midwest. Catastrophe losses happen from time to time and there are proper reinsurance treaties if the losses overflow the limit. YTD May combined ratio is good at 89.7%.
The drivers of PIF growth are new business and retention, the latter being a far stronger driver. We are given data on PIF but not the breakdown of which are new versus renewals. Nevertheless, based on what we can gather the YTD May 2024 combined ratio result looks well below PGR’s target of 96%.
Assuming that management is confident of their loss estimates we are likely to see higher growth rates towards the end of this year consistent with achieving a 96% combined ratio.
Capital Allocation
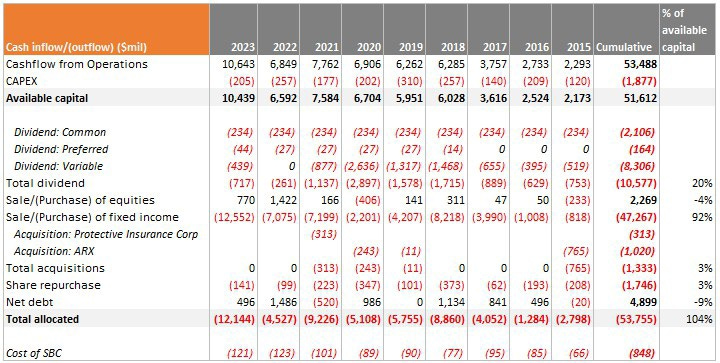
Below is the summary of how PGR allocates capital. Obviously the highest allocation goes to purchasing fixed income assets to support the loss reserves liabilities. Cumulatively, PGR allocates 20% for dividends and only 3% to share repurchases. There was only 2 recent acquisitions that utilised only 3% of capital. It is also interesting to see that PGR is a net seller of equities.
Putting altogether, PGR utilised 104% of the available capital it generated from operations:
Fixed Income Portfolio
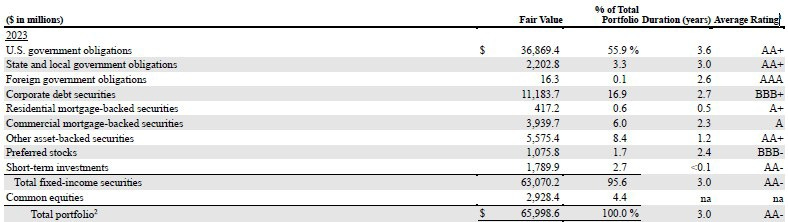
Fixed income securities are generally of good credit rating on average. The allocation strategy is to maintain 0–25% in common equities and non-investment grade fixed income, with the balance 75–100% in short-term and investment grade fixed income (source: 10K pg. 136).
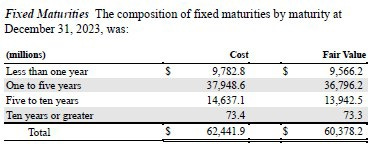
PGR keeps the maturities at the short end. Maturities within 5 years make up 76.3% of fixed income measured at cost:
PGR benefits from higher interest rates, fixed income yields against the cost basis in 2023: 2.7% vs 2022: 2.1% (fixed maturities cost basis 2022: $50,264m).
Equity Portfolio
PGR equity portfolio is valued at $3.2b as at end Q1 2024 compared to a cost basis of $0.7b, with unrealized gains at $2.5b. PGR portfolio is extremely diversified, majority of their equities are tracking the Russell 1000 index, and in 2023 this portfolio achieved total returns of 26.7% (S&P500: 26.3%).
Share Repurchases
In Q1 2024, PGR repurchased 223,643 shares at average price of $163.8, costing $37m. Management stated that the intention is to offset dilution caused by stock-based compensation.
We also observe that share repurchases are opportunistic during market downturns when PGR had relatively lower underwriting multiples and higher FCF yields (during years 2020, 2018, 2015).
Stock Based Compensation
PGR’s incentive compensation programs include both non-equity incentive plans (cash) and equity incentive plans.
Cash incentive compensation includes an annual cash incentive program (Gainshare Plan, 2023 10K Exhibit 10.1) for nearly all employees. Performance metrics are PIF growth and profitability defined by the GAAP combined ratio.
Equity incentive compensation plans provide for the granting of restricted stock unit awards to key members of management.
Acquisitions
Two main acquisitions of recent years:
1. In 2021, PGR bought Protective Insurance Corporation for $338m cash. The book value was $300m with debts of $20m.
2. In 2015, PGR acquired 63.2% of ARX shares and an additional 1% of ARX capital stock from certain employee shareholders and option holders. The total cost to acquire these shares was $890m and was funded with available cash. Prior to the acquisition, PGR held a 5% interest in ARX as part of the investment portfolio.
PGR followed up to increase its ownership of ARX to over 80% in 2018 through buying more shares costing $296m. In 2020, PGR bought all remaining shares for $243m. Then in 2022, PGR recorded goodwill impairment of $224.8m.
As of 2023, 98% of the $228m goodwill recorded on PGR’s balance sheet is attributed to ARX. The total transaction cost was $1.4b.
Debt
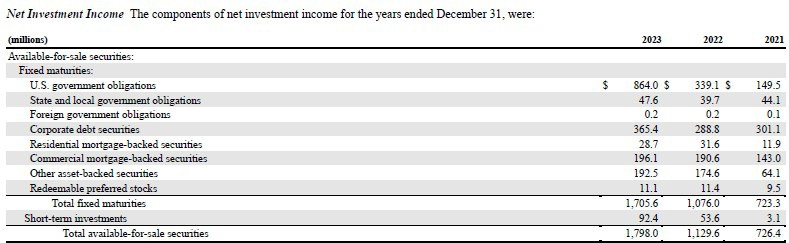
Outstanding debt of $6.9b is about 34% of equity. We don’t see the debt as a concern because the investment income from fixed income securities of $1,798m more than pays off interest expense of $268m.
Valuation: Free Cashflow (FCF) Yield
We decided to review PGR because this insurer is very capable of underwriting discipline and generating above 20% ROE on average. The free cashflow conversion rate is also very high because loss reserves for future claims are the largest item in the P&L, but setting up reserves is a non-cash item. Essentially it means that policyholders are giving cash to PGR as premiums, but PGR does not incur any cash outflows until a claim is settled. This form of leverage is called insurance float. The cost of this float can be negative if PGR underwrites profitably, by matching the correct price with risk. The last time PGR made underwriting losses was 24 years ago, with a mere cost of 4.4%! This incredible skill and discipline in underwriting resulted in a negative cost of float, in other words, policyholders “pay” PGR to hold onto the premiums while PGR benefits from investing them in fixed income.
Below shows the 10 year record:
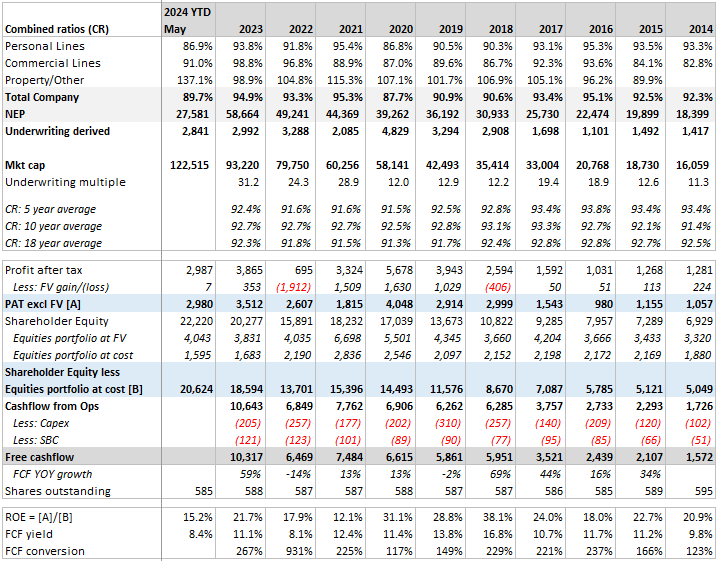
At current market cap of $122.5b, we are getting a FCF yield of 8.4% using 2023 FCF of $10.3b. The 10 year average ROE is 24%, note that we have to do 2 adjustments to normalize the ROE due to erratic mark-to-market FV movement of the equity portfolio:
Adjust PAT to exclude FV gain/(loss)
Adjust shareholder equity to exclude equities portfolio at cost basis
Our baseline scenario: PGR achieves PIF growth 8% while keeping 96% combined ratio, then we think 8.4% FCF yield is a fair price to pay for a business that is able to produce above 20% ROE.
Suppose NEP grows by +8% to $63.4b, this is pure volume without price increases.
At combined ratio of 96%, underwriting profit = $2.5b.
Add on investment income of $1.9b same as last year.
Profit before tax = $4.4b, PAT = $3.5b (tax 21%, excluding FV).
This baseline assumes no PAT growth from last year. We don’t expect the FCF conversion to be different, therefore at least $10b of FCF is expected. Q1 2024 PGR reported FCF of $4.1b (PAT to FCF conversion of 178%).
There are 3 assumptions that provide margin of safety:
1. Investment income can be higher as maturities are rolled forward into higher current rates.
2. Prices can increase.
3. Combined ratio can be below 96%.
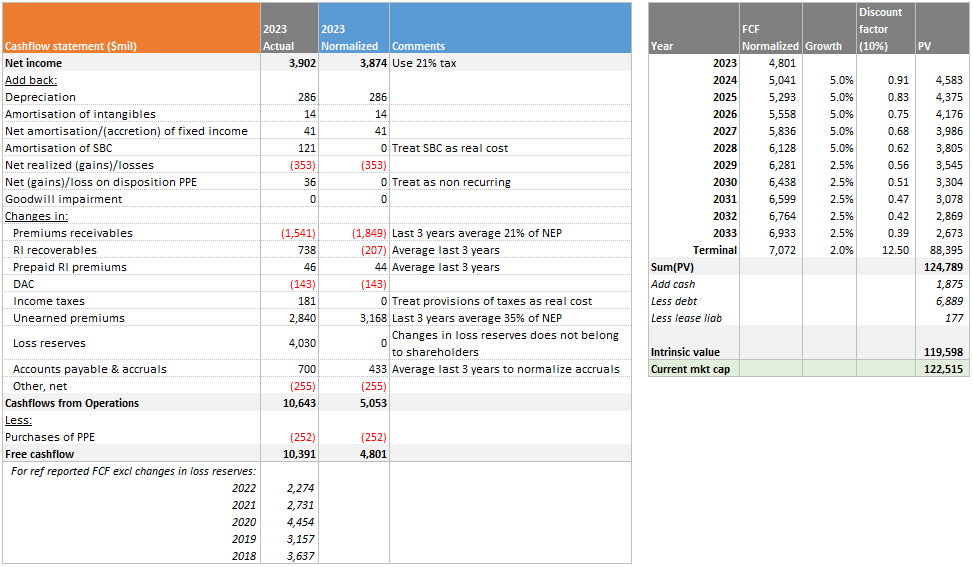
Valuation: Normalize FCF & Reverse DCF
We will attempt to normalize the FCF under these principles:
Normalize tax rate at a higher 21%
Include cost of SBC
Changes in loss reserves are excluded
Changes in working capital generally use past year averages. The main components that use historical average % of NEP are premiums receivables and unearned premiums
Our starting FCF is normalized to $4.8b from the reported $10.4b, the main item we have to exclude is changes in loss reserves because it does not belong to shareholders.
Next we do a reverse DCF to see what kind of growth profile we need at discount rate of 10% to justify today’s market cap of $122b:
Valution: Reinvesting at 2.8x Leverage
In the 2023 10K pg. 148, PGR reports the ratio of net written premium to statutory capital. This ratio represents underwriting leverage and it was consistently 2.8x over the past decade.
1. Suppose that PGR does 96% combined ratio at 2.8x leverage, it would produce ROE = 4% * 2.8 = 11%.
2. Add on investment portfolio yield of 2%, ROE = 11% + 2% = 13%.
3. PGR retains on average 80% of FCF after paying out dividends, assuming it reinvests into the business at 13%, then we expect intrinsic value growth = 80% * 13% = 10%.
4. Add on dividends and the expected forward total return should be about 11%.
The extra points in returns will come if PGR can achieve lower than 96% combined ratio. Historical long run actual combined ratio was about 93%.
Risk #1: Underwriting Leverage
The biggest risk is PGR making underwriting losses coupled with writing premiums at high leverage.
Most insurers write 1–1.5x against their statutory capital as this leverage magnifies underwriting losses. For example, at 2.8x leverage, a 105% combined ratio will decrease 14% (= 5%*2.8) of capital.
As at end 2023, PGR shareholder equity is $20.3b and NEP is $58.7b. For comparison purposes, the magnitude of a 105% combined ratio will incur a loss equal to all the unrealized gains of the equity portfolio.
Since 1986, PGR has only recorded 2 years of 105% combined ratio in 2000 and 1991.
Risk #2: Unexpected Losses
1. PGR has been able to grow rapidly because they’ve enjoyed exceptional returns on their advertising. It’s possible, however, that they eventually reach a point where the low hanging fruit has been picked. Auto insurance has commodity-like qualities where insurers compete on lowering prices. Although there is a limit on how low prices can be given the risk level, most insurers don’t mind making underwriting losses because they can make it back from investment income. The solution is then to be a low-cost operator, and PGR might need to move more of the business mix to direct selling channel.
2. A series of underwriting errors could erode PGR’s capital and require it to raise dilutive equity at unattractive prices. Warren Buffett recounts how underwriting errors nearly killed GEICO in the early 1970s:
Between 1936 and 1975, GEICO grew from a standing start to a 4% market share, becoming the country’s fourth largest auto insurer. During most of this period, the company was superbly managed, achieving both excellent volume gains and high profits. It looked unstoppable. But after my friend and hero Lorimer Davidson retired as CEO in 1970, his successors soon made a huge mistake by under-reserving for losses. This produced faulty cost information, which in turn produced inadequate pricing. By 1976, GEICO was on the brink of failure.
PGR has large and important resources in the departments of data and actuary, so a failure to underwrite profitably would likely require a culture failure within the company.
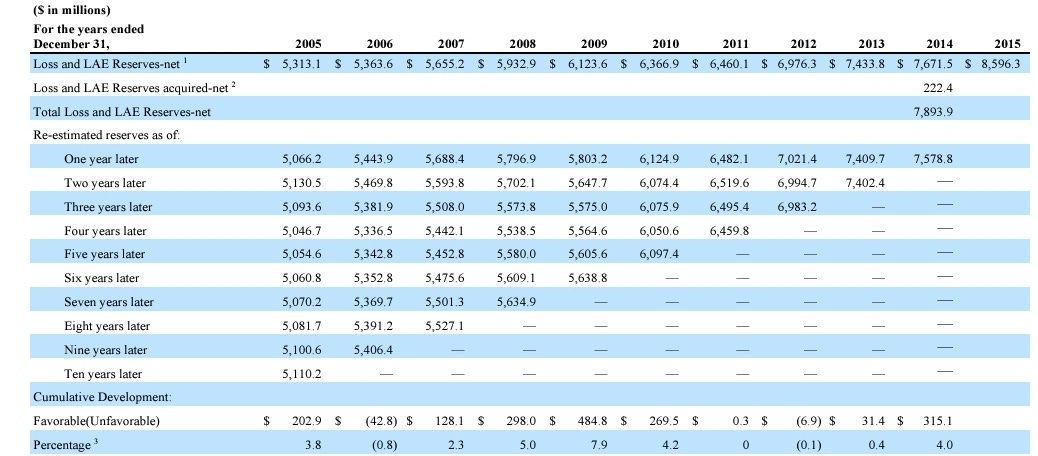
We want to bring up the loss development triangle before and after 2016, the year Tricia Griffith became CEO.
Below is 2005 to 2015 loss development, underwriting was prudent with more surplus than deficits in reserves:
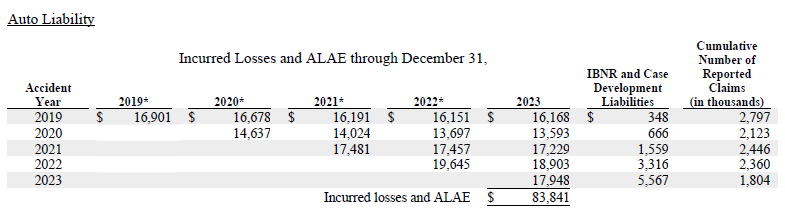
Next we look at the most recent loss development:
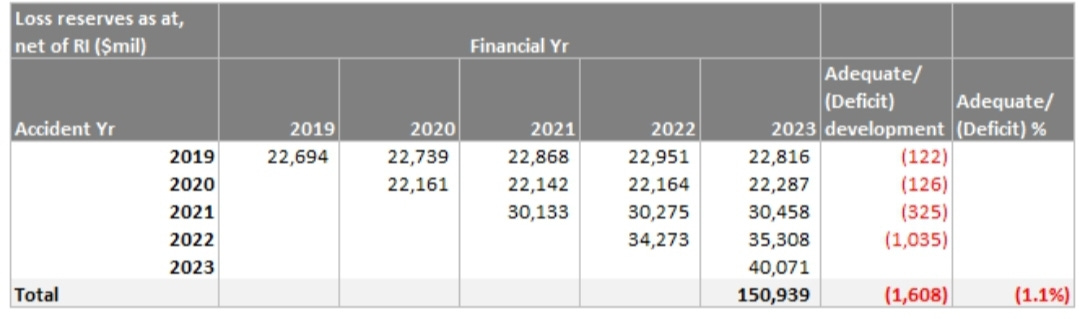
There are 4 straight years of reserving deficits, this is prehaps the largest concern as we will not know the future reserves developments until it occurs. If this trend continues, then we have a risk that future profitability will be impaired by today’s growth.
Compared to GEICO reserves were more redundant than deficient: