
CPRT: Copart (9)
Preface
We are back with yet another CPRT article! It’s one of our favourite businesses to study.
This post will directly address the financial model, economics of the business, and valuation.
How CPRT Makes Money
CPRT revenue is generated through two segments:
Service revenues
Purchased vehicle sales
Service revenues constitute the majority of CPRT income and consist of various transaction-based fees charged to both sellers and buyers during the auction process.
On the seller side, CPRT often (not everyone in Europe subscribes) utilizes its Percentage Incentive Program (PIP), where it earns a predetermined percentage of the final auction price, typically ranging from 10% for high-value units to 20% for older or highly damaged cars.
This model aligns both CPRT and insurers’ interests, as higher auction prices result in higher fees for CPRT and better claims recovery for the insurer.
Other service fees include towing fees, title processing, storage, and specialized merchandising.
On the buyer side, CPRT charges commissions based on the average selling price of the vehicle, alongside additional fees for loading, bidding, and annual membership registration. Buyer-side fees account for the majority of service revenues.
Purchased vehicle sales, involves CPRT acting as a principal, meaning that CPRT purchases vehicles outright, primarily from individuals through its “Cash For Cars” program or in overseas markets to establish market liquidity, and then resells them for its own account.
For these transactions, the entire gross sales price at auction is recorded as revenue. While service revenues have high operating margins of ~40%, the purchased vehicle segment carries lower margins but serves as a strategic tool for expansion and supply diversification.
Additionally, in specific markets like Germany and Spain, CPRT generates revenue from listing fees paid by insurance experts who use the platform to determine a vehicle’s residual value even if it is not sold directly through a CPRT auction.
How Vehicles Are Totaled
Generally, vehicles enter CPRT ecosystem following a collision or significant mechanical failure. At this juncture, the insurer must perform a cost-benefit analysis. A vehicle is totaled (total-loss) if:
Repair cost > Pre-accident value – Salvage value
Repair Costs: An increase in labour or parts costs, ceteris paribus, elevates total loss rates.
Salvage Value: As the resale value of scrap and parts rises, insurers are more incentivized to deem the car totaled, leading to higher total loss rates.
Pre-Accident Value (PAV): Higher PAVs often driven by a robust secondary used-car market, make repairs more attractive, reducing total loss rates.
The economics can then be reduced to a simple fact: Any economic force that simultaneously increases repair costs and salvage value, results in more business for CPRT.
Therefore, the frequency of accidents & claims, represents the most critical driver in CPRT business. The industry calls this total loss frequency.
Total Loss Frequency
Total loss frequency has climbed from approximately 4% in 1980 to 23% in 2025. The existence of CPRT actually drive this trend upwards. Because CPRT operates a two-sided network with a global buyer base, more demand means higher salvage prices, which in turn makes it more economically attractive for insurers to deem a vehicle as totaled.
However, we must be aware that total loss frequency is a ratio:
The numerator is the number of totaled vehicles.
The denominator is number of claims.
What we want is strictly the numerator going up, and not the denominator going down. If number of claims decrease because of structural factors (eg. autonomous vehicles), then the mathematically higher total loss frequency is actually detrimental to CPRT.
Unit volumes are the important thing; not percentage values.
Factors Affecting Volumes
This is one of the reasons why we love businesses like CPRT. The factors driving growth can be easily identified and understood.
Older Fleet
It is obvious that the increasing average age of the vehicle fleet makes cars more prone to being totaled because their PAVs are lower.
As vehicles age and their market value depreciates, the threshold at which repair costs exceed the PAV becomes easier to reach, particularly as repair costs continue to rise secularly due to labour inflation and shortage of skilled mechanics.
In the US, the average age of light vehicles keeps getting older. It was 8.4 years in 2002, 11.5 years in 2015, and 12.8 years in 2025.
As a result, 62% of vehicles on the road are above 12 years old, and 88% are at least 7 years old.
According to S&P Global Mobility, the rate at which vehicles are retired (scrapped) has remained stable at ~4.5%. On a national fleet of ~300 million vehicles, this translates to an annual retirement volume of 13.5 million vehicles.
Absent a sudden surge in new vehicles, this trend is the basis of organic growth. As the fleet continues to age, the vehicle retirement rate will experience upward pressure, directly expanding CPRT volumes.
We can see evidence of this in the distribution of total loss valuations.
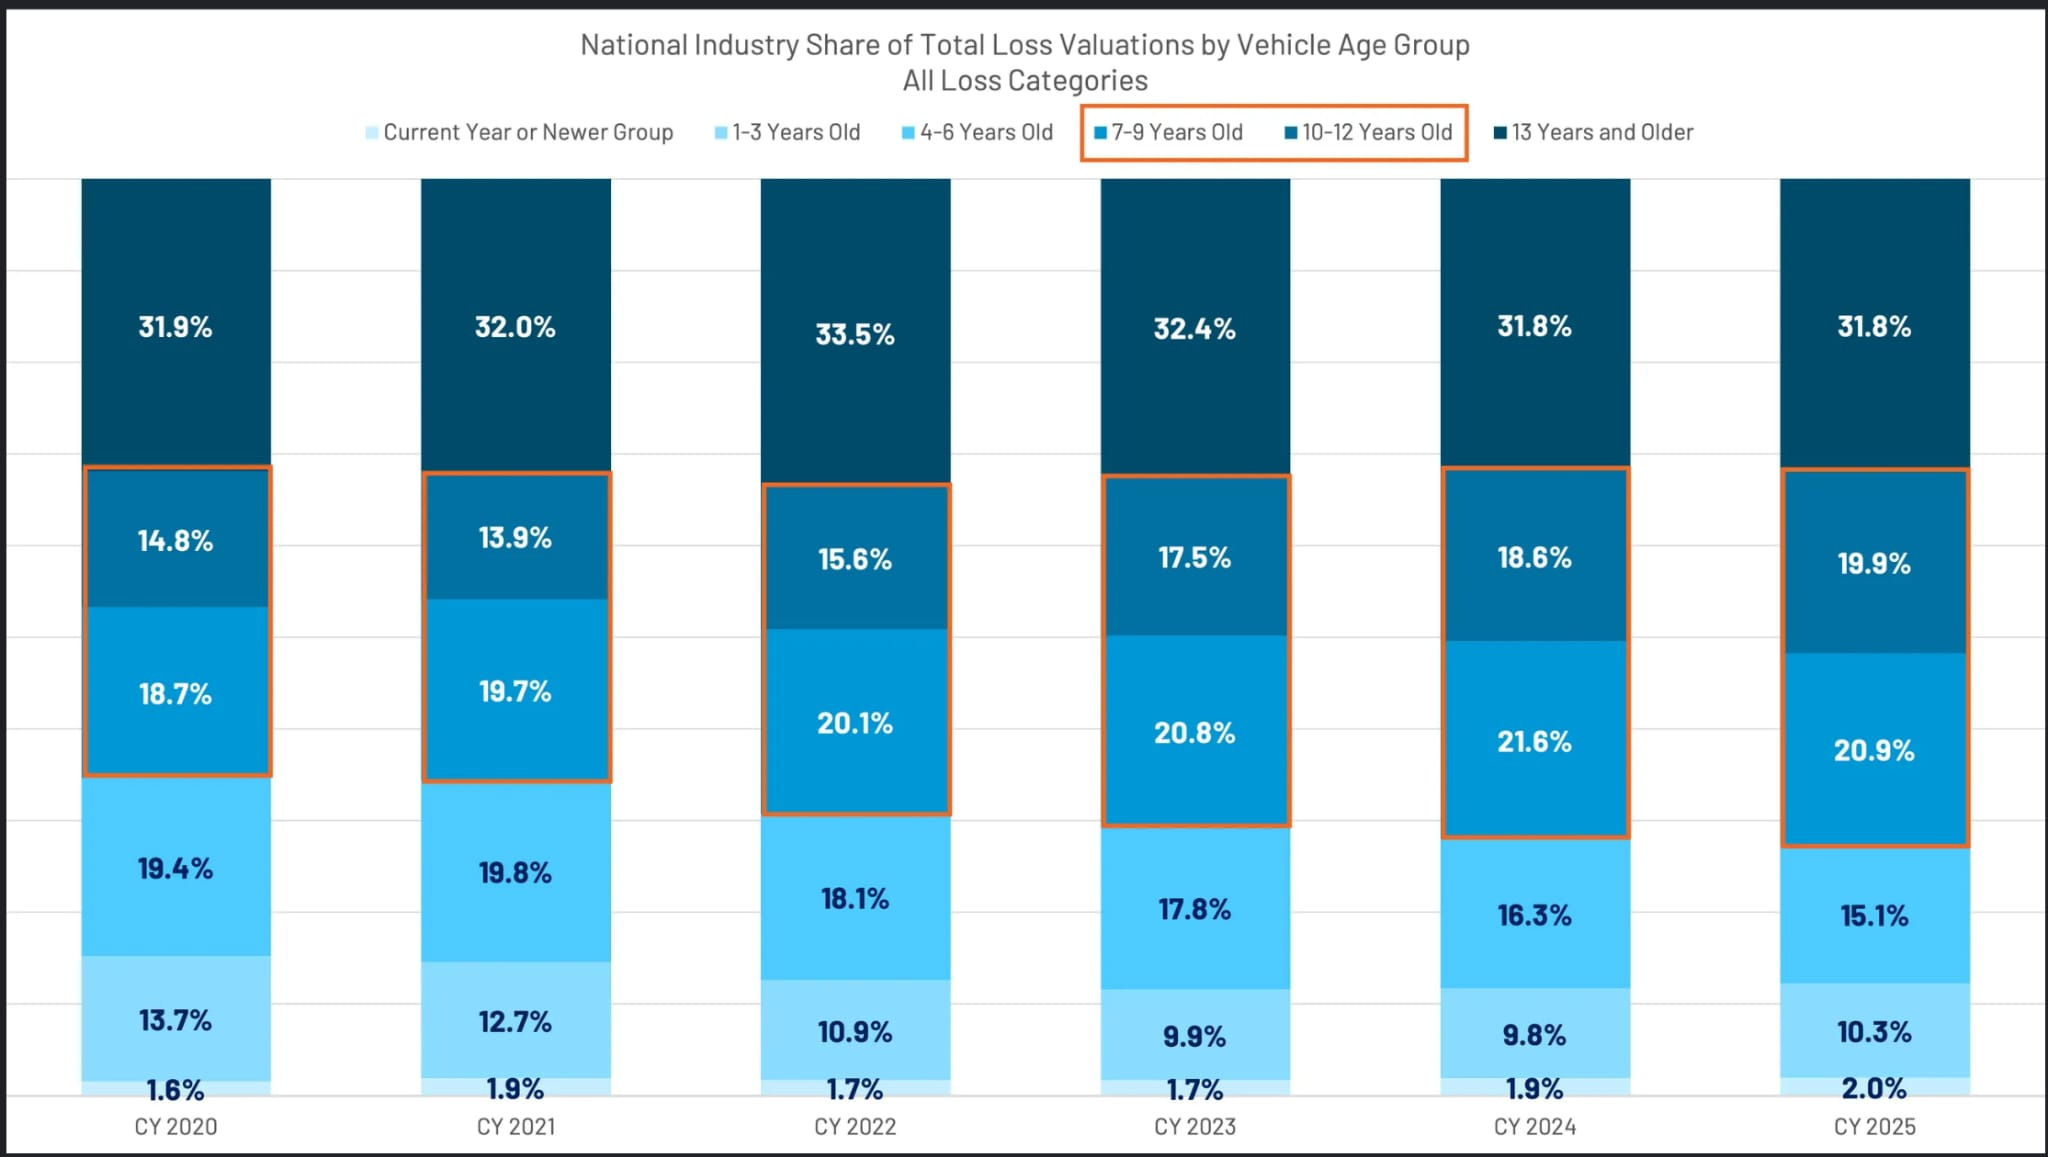
The chart demonstrates a progressive shift in the composition of totaled vehicles toward older age brackets. This confirms that older vehicles are increasingly becoming the primary drivers of volumes.
Repair Costs
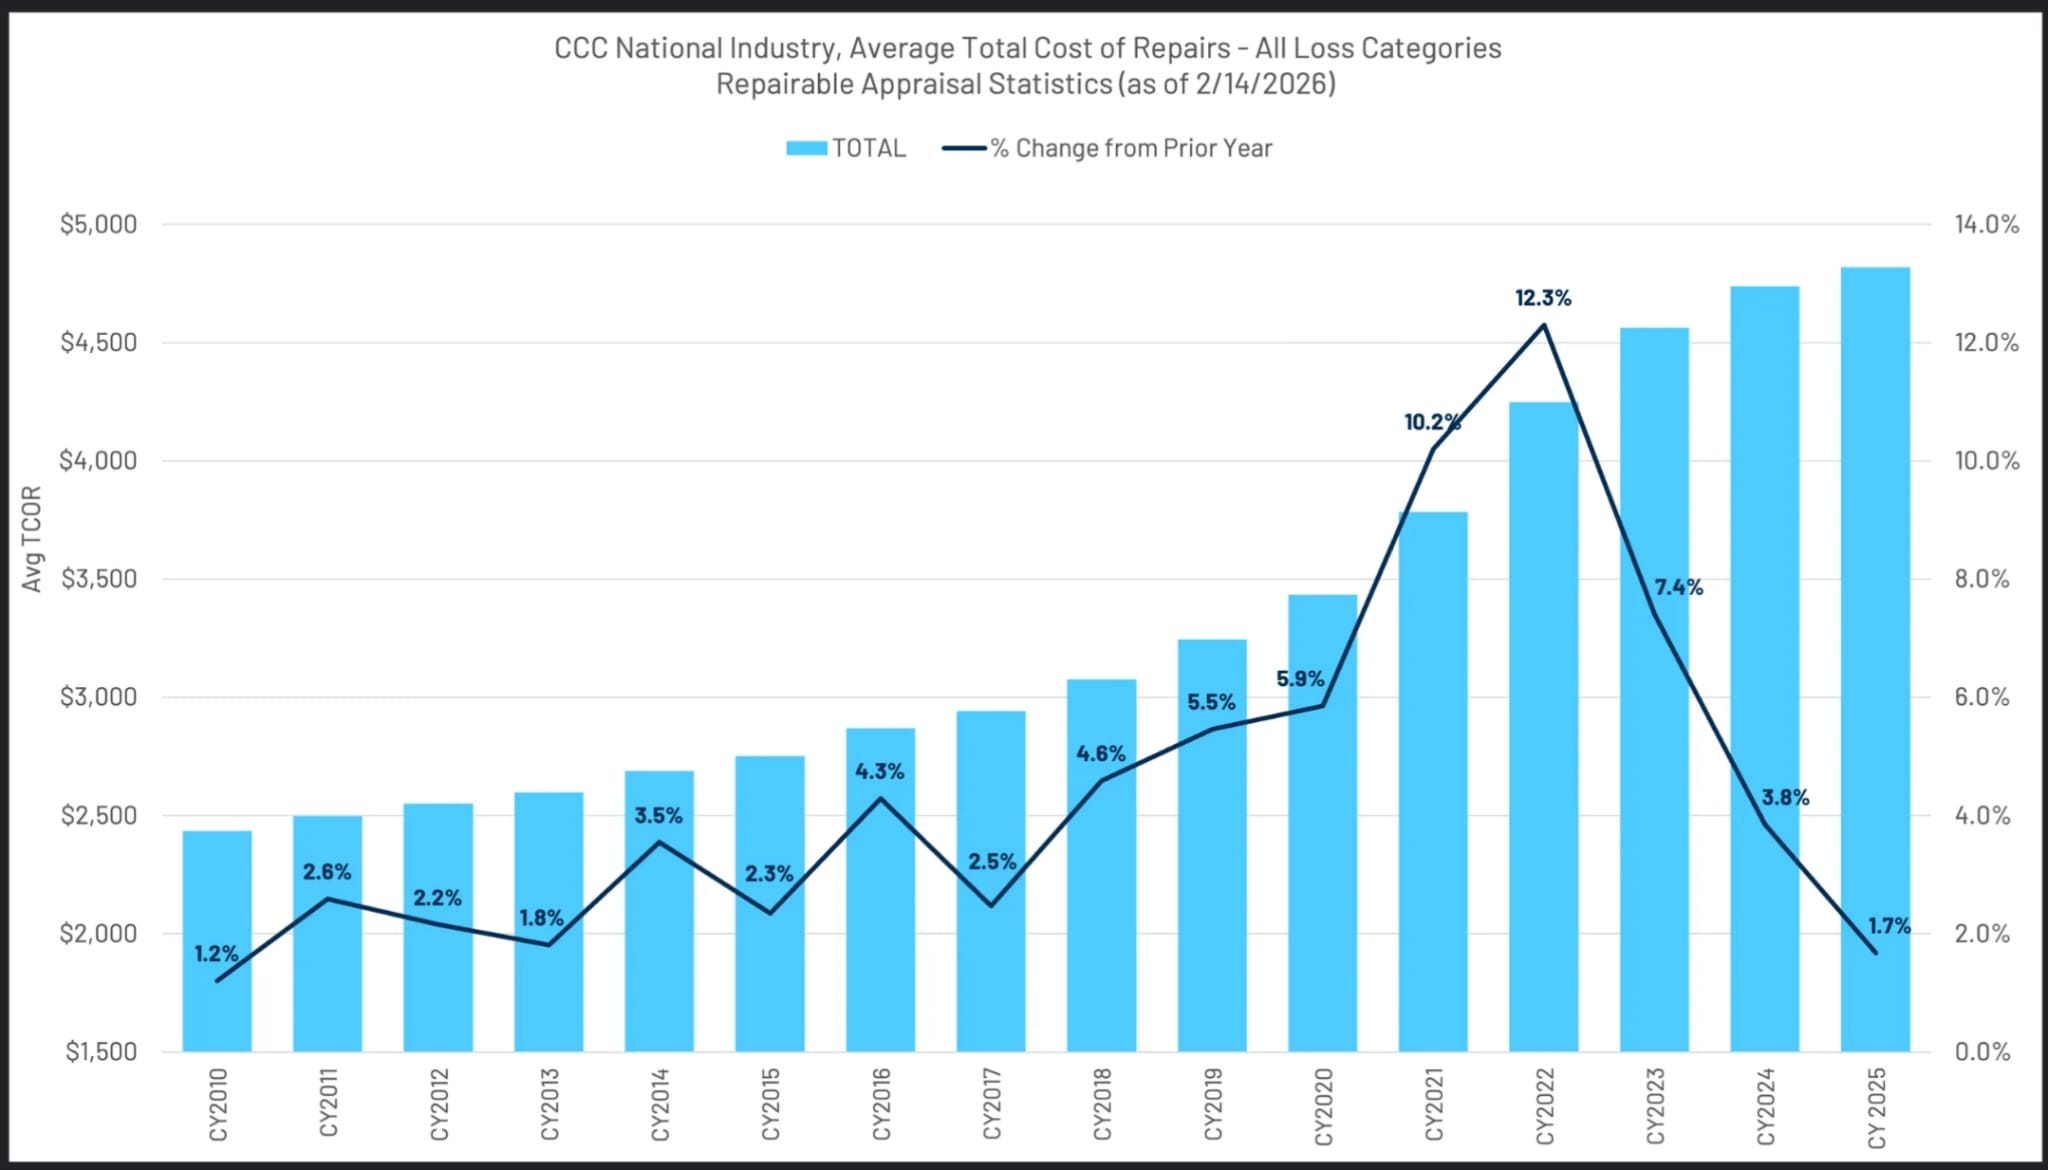
Rapid advances in vehicle technology and complexity have made even newer, high-value vehicles more expensive and difficult to repair. Modern cars now contain between 1000 and 3000 semiconductors.
Safety features are now all around the perimeter of a car, turning a small accident into an expensive repair situation.
We don't see any logical reason for repair cost to decrease in the long run:
Vehicle Miles Travelled
The US population has nearly doubled since 1960, but vehicle miles travelled have quadrupled as mobility remains an essential need. Despite long-term declines in accident rates due to safety technology, the absolute number of accidents has remained relatively stable. Remember unit volumes is the focus!
Factors Affecting Number of Claims
The factors that negatively affects CPRT is equally easy to understand.
Lower Accident Rates
While the safety features of modern vehicles result in higher repair costs, it also reduces accident rates. Since 1988, vehicle crashes fell from 3.9 to 2.1 per million miles (CAGR -1.8%).
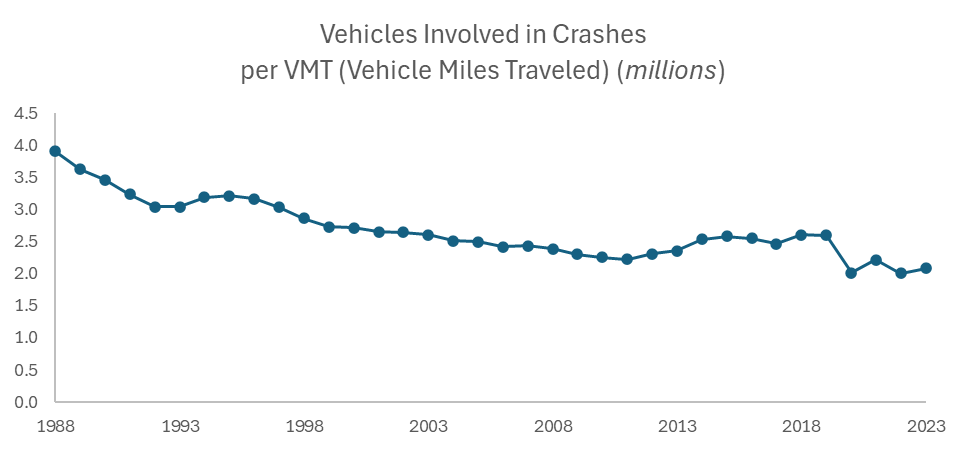
As the industry moves toward higher levels of autonomous capability, this downward trend should persist. The eventual danger for the industry may occur when autonomous vehicles (AV) saturation reaches a critical mass, potentially leading to a non-linear collapse in accident rates.
However, the math is in CPRT favour. The transition to a majority AV fleet is a multi-decade process. There are 300 million cars on the roads in the US and only ~16 million new cars sold annually, it would take at least 19 years to fully replace the entire fleet if every new car sold today were fully autonomous. This doesn’t cater for the less developed countries where AV adoption is very slow.
The real question, unsurprisingly, is not AV adoption but how current safety features can accelerate the decline in accident rates.
Here, the asymmetry of higher repair cost more than offset the lower accident rates. Evidence is in the continued rise of total loss frequency even as accident rates have fallen, proving that the cost effect is stronger than the frequency effect.
We do not expect this relationship to change until AVs are capable of preventing accidents, and that remains far from meaningful fleet penetration.
From a financial modelling standpoint, such far out cash flows have insignificant time value.
Under-insured & Uninsured
The situation where drivers are opting for higher deductibles or even going uninsured is a problem that arose recently.
High inflation and rising insurance premiums have created affordability pressures:
24% of consumers reported downgrading or dropping insurance in 2025.
8% moved from full coverage to liability-only.
26% of policyholders now carry deductibles of above $1,000. When drivers have higher deductibles, they pay less premiums, but if the repair cost is lower than $1,000 then the insurer reimburses nothing. The driver may just live with the damages or repair it themselves. This escapes CPRT ecosystem.
We see this problem as cyclical and not structural.
The current tariff environment is creating a new potential headwind through a similar mechanism. As import tariffs raise the cost of new vehicles, demand shifts into the used market, elevating pre-accident values and making expensive repairs more economically viable relative to salvaging. Should this dynamic persist, it could temporarily suppress total loss frequency in the near term.
Competitor IAA
The salvage vehicle industry is effectively a duopoly. There are 3 competitive advantages CPRT has over IAA:
Full ownership of land (>90% arceage).
Global buyer network.
Leader in auction technology.
Land Ownership
Each of these moats are not easy to breach. Especially CPRT ownership of land which makes them free from landlord demands. In this business, special permit land is essential for survival, otherwise where would you park salvage vehicles?
This structural advantage has resulted in a superior financial profile. CPRT maintains operating margins of ~37% and ROIC that's consistently higher than IAA.
We can try to quantify this land ownership moat by pretending that CPRT rents all their land:
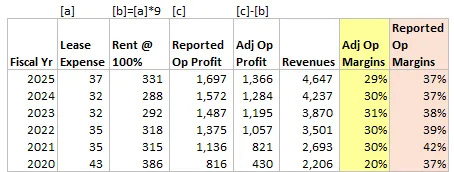
With this adjustment, the operating margins (yellow column) is definitely lower than reported, but it’s still easily above 20%.
More importantly, this implies that the land ownership strategy adds 1000bps of margins for CPRT!
Global Buyers
The international reach is also a major differentiator. IAA’s buyer base remains largely domestic for years, but CPRT auctions are truly global.
While there are no clear figures, the general consensus is that CPRT currently commands a dominant market share of 50%, processing over 4 million vehicles annually.
They have over 1 million registered members across 175 countries. International buyers are vital to this ecosystem, participating in 90% of auctions for rebuildable vehicles and purchasing 40% of CPRT total US inventory.
Technology Lead
CPRT had a massive 17-year head start in digital transformation by eliminating live auctions in 2003, whereas IAA did not fully transition to a 100% online model until the 2020 pandemic.
IAA has made recent improvements in operational efficiency, reaching CPRT's 40—50 days inventory turnaround benchmark.
We think this technology gap will eventually close quickly. But the network effects and land ownership are advantages that have long lasting durability.
Duopoly Structure
It is interesting that the insurers who supply the salvage cars have incentives to prevent a monopoly market structure, because they don’t want to lose price bargaining power.
So this limits CPRT ability to gain market share beyond a limit that insurers feel like that have lost bargaining power.
As a result, insurers will occasionally switch to IAA to ensure that the weaker player is still a threat. For example, State Farm and PGR have indicated that if the market share becomes too much in CPRT favor, they are willing to intentionally move volume back to IAA to stabilize the industry.
Consequently, while CPRT may be the more efficient operator, its ability to capture the entire US market is naturally capped by its customers’ own self-interest in preserving competition.
Inflection Point
All the above are already well-known by the market. However, recently the valuation of CPRT shares have reached levels last seen 10 years ago, even though fundamentals have improved drastically.
This inexpensive valuation coincides with the largest cash position in history and zero debt. The board has approved a $1.17b buyback program, also the largest ever.
We need to think about capital allocation!
For 17 years after IPO in 1994, CPRT did not repurchase any shares, choosing instead to focus on reinvesting and building a national footprint. This was the right thing to do because the return on incremental capital was super high during the early years.
It was only in 2007, after management became convinced of the business resiliency, that they began to deploy excess cash for opportunistic and aggressive share repurchases.
To show the highly conservative approach, it was only until 2011 that CPRT issued its first debt! It was a $400m note specifically to fund a massive tender offer at $2.37/share (adjusted 16x stock split), which allowed them to repurchase ~20% of the total share count. This repurchase exercise is 14x lower than today’s price, even after a one-year draw down of -43%!
In 2016, they had another large tender offer repurchasing 7.1% of share count for $600m.
But they have stopped since 2019 as valuations have remained above the levels management considers cheap.
Today's valuation is at 2016 levels, and management has explicitly stated in the latest earnings call that they think CPRT shares are cheap relative to intrinsic value.
The most recent quarter, repurchases deployed $218m at $39.82/share.
We think this is a very strong signal of undervaluation and serves as an inflection point when cyclical factors turn for the better.
Valuation
The valuation is very easy and requires no heroic assumptions for above market returns.
Organic Growth
Historically, annual insurance claims represent 10% to 15% of total fleet (300 million vehicles), equating to 30 to 45 million potential salvage units.
Let’s assume 35 million units. Given that we know that current loss frequency is 23%, this means that the addressable market is 8 million units. CPRT processes 4 million units which is 50% market share (fair assumption).
As mentioned earlier, two factors can increase organic volumes:
Number of claims
Total loss frequency
For the next 5 years, an organic growth of 4% will give 4.9 million units.
With these assumptions, we derive the required total loss frequency:
Total fleet constant at 300 million.
Insurance claims remain weak at 12%.
CPRT market share 50%.
Working backwards total loss frequency = 27%. (12%*300*27%*50% = 4.9 million units)
Is it possible for total loss frequency to gain 4 percentage points in 5 years?
We don’t think it's a stretch. Furthermore, we are assuming:
Zero organic growth for ancillary business lines (BlueCar, Powersports…).
Zero organic growth for international business.
No catastrophe events that boost CPRT volumes.
If the economy turns better, affordability pressures will ease, and claims volume should increase too.
Inorganic Growth
Historically over last 10 years:
ROIC = 31%
Reinvestment rate = 41%
Working backwards to clear our required 10% hurdle rate, we can assume ROIC 25% and reinvestment rate 30%. Multiplying the numbers, inorganic growth is 7.5%.
Total growth = organic + inorganic = 10.5%.
Now, we can proceed to estimate the free cash flow (FCF) per share. There are 975 million diluted shares outstanding after the recent repurchases. If they retire 3% shares per year, after 5 years they will have 841 million shares.
Put together:
FCF (FY2025) = $1155m = $1.18/share
FCF (FY2030) = $1902m = $2.26/share
We nearly double FCF/share in 5 years, or ~15% CAGR.
This model doesn’t require multiples to re-rate. But it needs a few things to happen:
Total loss frequency to increase.
IAA unable to close the operational gaps in any meaningful way.
ROIC and reinvestment rate remains strong above 25%.
Management maintains capital allocation discipline. If multiples expand again, they should stop repurchases.
After expounding on the virtues of CPRT, we think all these assumptions are highly likely to be true.
We will continue adding shares at current $33/share.
Well written article. IAA unit volumes are growing faster than CPRT’s for 4 quarters. They are taking share, possibly due to their mix of insurers (Progressive / State Farm) (growing faster than the market. IAA ceded 10-15% of market share to CPRT over recent years due to mismanagement. Under RBA’s ownership, IAA has invested in the business, fixed most of its issues and largely ‘caught up’ to CPRT. IAA hinted that they think they can take more share given RFP pipeline. My question: what makes you think IAA won’t continue to claw back some share which would be a headwind to CPRT’s growth rate? As you said, insurers want at least two viable options to give them some leverage in negotiations.
Also regarding the roic calculation for inorganic growth, where do you reckon they will get this growth from?