
CPRT: Copart (6)
Q1 2026 Updates
We have written about CPRT many times in the past, interested readers can search the blog. Recently, our interest perked up due to the steep -29% stock price decline in just this year alone. Fundamentals of the business have all improved, we see this divergence as an opportunity.
CPRT reported Q1 2026 (fiscal year ends July) yesterday. The market reaction was negative again. Here’s some financial highlights YOY:
Total revenues grew +0.7% to $1,155m.
Operating income grew +6% from $406m to $431m. Margins expanded due to lower facilities operations cost from CAT (catastrophic) events last year, excluding that the growth was +4.5%.
Cash balances grew to $5.2b, this is 13% of the $40b market cap. Interest income grew by $8m (+17.5%).
CPRT continues to produce strong cash flows with $418m FCF (SBC is taken out) for Q1. Given that FY24 printed a record high $1.1b of FCF, this Q1 added another $183m against last year, making another record high of $1.2b FCF on TTM basis.
Q1 net income was $404m (+11.5%), giving a 35% net margin.
Q1 global insurance average selling price (ASP) increased +6.8%. The US segment increased +8.4%. Competitor IAA (under RBA) reported ASP +2.5%.
Unit volumes adjusted for CAT events continued to decline -4.6% YOY. Management attributed it to cyclical weakness in the auto insurance market where the number of uninsured motorists have been increasing due to premiums inflation. There is also people choosing less collision damage cover for lower premiums.
Currently, the important metric to monitor is the % of International region’s service revenues. Other than total revenues increasing, we should see a larger portion of it going to service rather than vehicle sales. The progress is steady as proportion of service revenues inched higher from 66% (2025) to 67%:
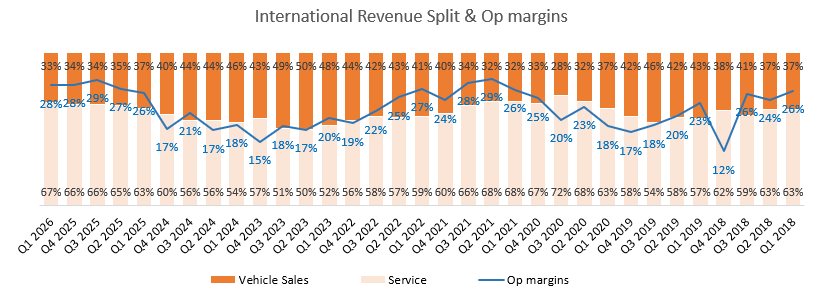
As more revenues come from services, the International region’s margins will improve (Q1 2026: 28%, Q1 2025: 26%).
This is still far from US region’s ~39% margins (90% service revenues). We don’t see any reason why the International region’s (mostly Europe) margins cannot continue to improve.
On total company, the revenue split by type and overall operating margins:
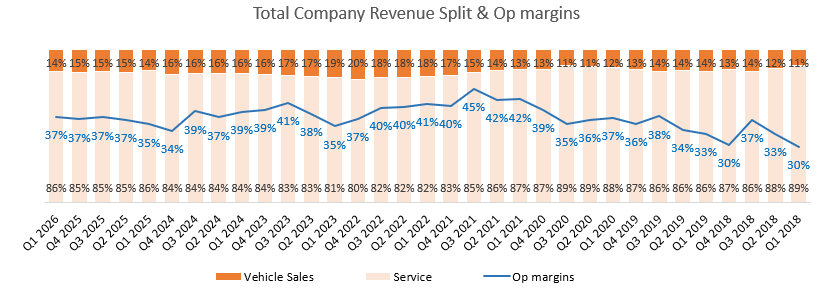
Over time margins are stable averaging 37%. The 2021 levels above 40% was due to abnormally high ASP following the supply crunch from COVID.
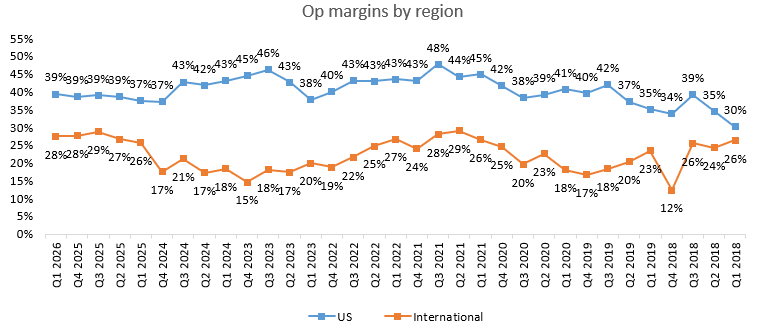
If we break the margins by region, we can see that International is improving slowly:
Singing Praises From the Altar
The priesthood within us can’t resist but to preach the economic virtues of CPRT again.
From time to time, we find it meaningful to reflect on the fundamentals of CPRT business. There are 3 areas we want to explain:
Core growth drivers of insurance salvage market.
Addressable market of vehicles from sellers beyond insurers.
Investment approach to succeed in both.
Core Drivers
Since 1960, the US population has nearly doubled while vehicle miles traveled (VMT) have quadrupled. Because the growth rates of each are modest, we must compare the effects over decades to see the significant divergence between them.
What explains the outsized growth of VMT versus population?
Well, mobility is both an essential need and luxury: Americans have to drive everyday for access to daily activities. As cities become denser, new roads are being built, hence the distance traveled will inevitably increase.
Alongside this increase in VMT, automotive safety technologies and autonomous driving have improved over the last decade.
These developments are good for society, but may sound detrimental to CPRT. However, you shouldn’t ignore the inherent stability of reality; new technologies gradually penetrate new vehicle shipments, which still more gradually penetrate the installed base, leading to a slow, steady decline in the number of accidents per miles driven.
It’s true that accident rates fell for decades, but the absolute number of accidents has declined by only 8% over the past 30 years (1994: 6.5 million, 2023: 6.1 million). This is due the offsetting effects of population and VMT growth mentioned earlier.
To explain the decreasing trend of accidents, technology is the obvious answer.
In 1996, forward autonomous breaking systems were first introduced in the Denver Auto Show. Almost 29 years have past since then.
Nearly 50 years have past since the arrival of anti-lock brakes in 1978 (mass produced for Mercedes-Benz).
New technology waves, some anticipated and others unforeseen, will undoubtedly emerge in the years ahead with similar meaningful and incremental effects.
With all these forces above at play, how do we explain the persistent and predictable growth of the salvage cars industry?
Here we need to understand total loss frequency.
Although technology have directly reduced accident rates, they have also directly increased the cost of repair, both in dollars and time spent. Today’s cars have thousands of chips and sensors installed compared to virtually zero 50 years ago.
An similar accident today versus 20 years ago would force a repair that costs much more in time and money because of the dramatic increase in vehicle complexity. Today’s safety technologies, largely situated as cameras and sensors on the outside perimeter of vehicles, are especially prone to damage from even modest impact.
When an insurer estimates that the repair cost to be higher than salvage value, they will pay the claims and deem the vehicle as a total loss (totaled).
And in many cases, the totaled cars remain highly drivable to CPRT’s international customer base. They represent the many millions of people around the world who rely on totaled vehicles to fulfill their mobility needs.
Now, a higher total loss frequency must mean that the marginal vehicle has a higher probability of being totaled in an accident. This explains the trend of newer vehicles being totaled, which is the reason for higher average selling prices (ASP), and CPRT benefits as a business facilitating the sales of more expensive vehicles.
Therefore, since the 1980s, total loss frequency has only monotonically increased (1980: 4%, 2025: 22%).
As long as people continue to make vehicles and insurance companies continue to insure them, you can’t get rid of CPRT. This is the bedrock for CPRT core salvage business.
Sellers Beyond Insurers
As insurers bring milder damaged vehicles to CPRT, much of their inventory starts to look like a wholesale auction.
On the back of this, their member base, helped by marketing efforts, will expand over time, preserving the economic moat and network effects of CPRT’s ecosystem.
The US wholesale automotive resale industry transacts ~17 million vehicles annually, multiple times larger than the insurance salvage market. In addition, the ASP of wholesale used vehicle in the US is ~$19,000, well above insurance vehicles.
The industry is comprised of a wide spectrum of vehicles from type, model, age, mileage and condition. As total loss frequency moves further in CPRT favor, they can enhance the suite of services offered to dealers, rental car companies, financial institutions etc. We expect the addressable market of wholesale vehicles to expand further.
Investment Approach
CPRT owns the vast majority of their salvage facilities instead of leasing them. This ensures their ability to serve customers for decades to come, the business is not beholden to landlords.
Leasing will no doubt enhance reported financial numbers, but it does not widen the economic moat; rising land prices and restrictive permitting make their network of facilities nearly impossible to replicate.
Every hurricane season CPRT will go out and purchase land in anticipation of increased salvage volumes. During heavy hurricane years, they benefit from preparation, while some years they don’t fill up the yards. Across long enough time periods, bad hurricanes will inevitably happen and CPRT is well positioned.
The CPRT auction platform is also a technological edge over competitors. They had a huge first mover advantage when the auction system was launched in 2003.
Other competitors followed only more than 10 years later! This enabled CPRT to capture a network of members who remain sticky to their platform. We cannot understate the benefits of a two-sided network where efficient price discovery is only possible with a large number of buyers and sellers.
Because of this, investments into technology have made it a global service with members from 165 different countries.
Lastly, CPRT operates with zero long or short term debt. This conservatism might seem strange given the predictability of the business. It can be traced back to founder Willis Johnson who avoided debt as much as he could while building his business one junkyard at a time. Today, he’s on the Board as Chairman. His son-in-law, Jay Adair, took over as CEO in 2001. Then in 2024, Jeff Liaw (joined as CFO, 2016) became the CEO while Jay transitioned to Executive Chairman.
Autonomous Vehicles (AV)
This topic is a common risk question. If AV becomes mainstream, then accident rates should be dramatically lower.
AV is a new thing so we don’t have any equivalent past technologies to compare to. But a close relative we can check is the evolution of vehicle safety technology.
Let’s investigate some real world examples.
Electronic stability control (ESC) improves stability and reduces loss of traction by automatically applying brakes to help steer the vehicle where the driver intends to go.
The very first iteration was introduced in 1983 on the Toyota Crown. Mercedes and Toyota then introduced a second generation of ESC in 1995 for the S 600 Coupé and Crown Majesta.
From the second generation in 1995, it took about 22 years before 100% of new vehicles had this technology.
However, if we look at the total population of all registered vehicles, the penetration was still 82% after 29 years:
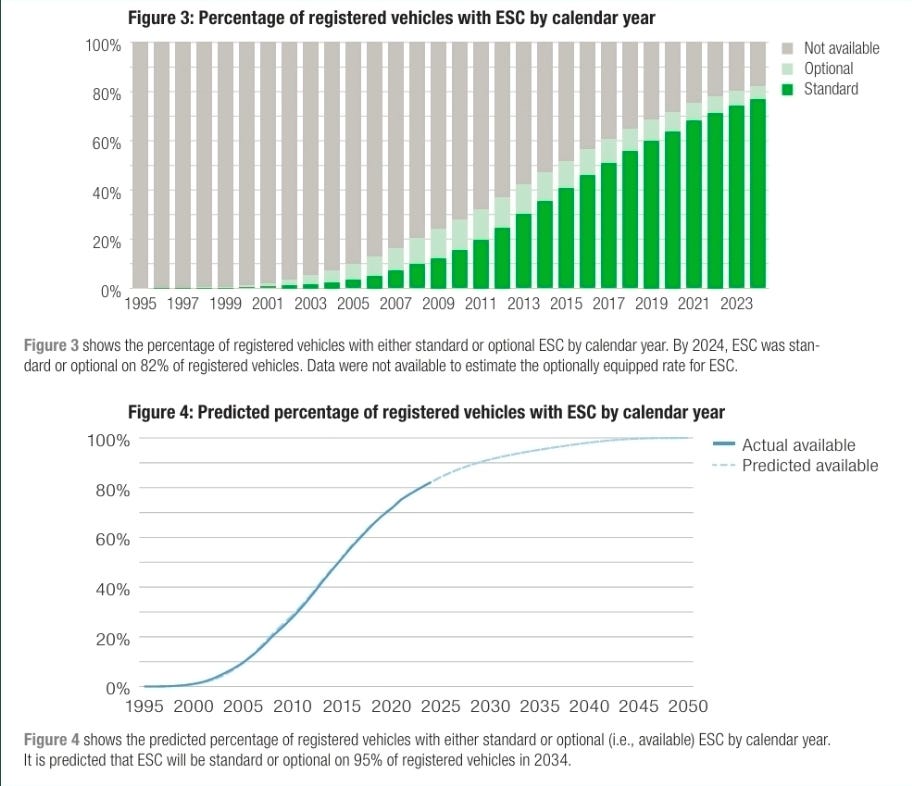
The Highway Loss Data Institute (HLDI) also predicts that ESC would be in 100% of vehicles by 2045.
If this projection is correct, then it would have taken 50 years for ESC safety tech to be in all vehicles since inception. That’s a long time.
We can check out other safety tech evolution, the story is similar, they take a long time to become prevalent:
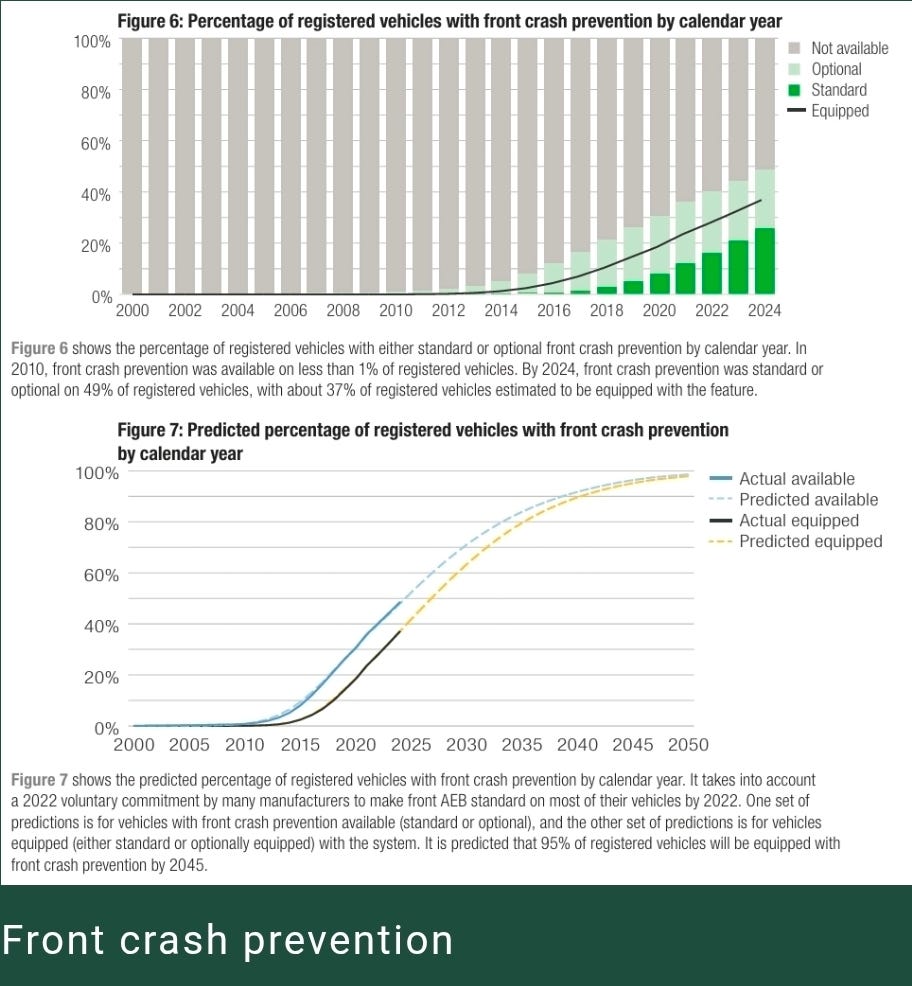
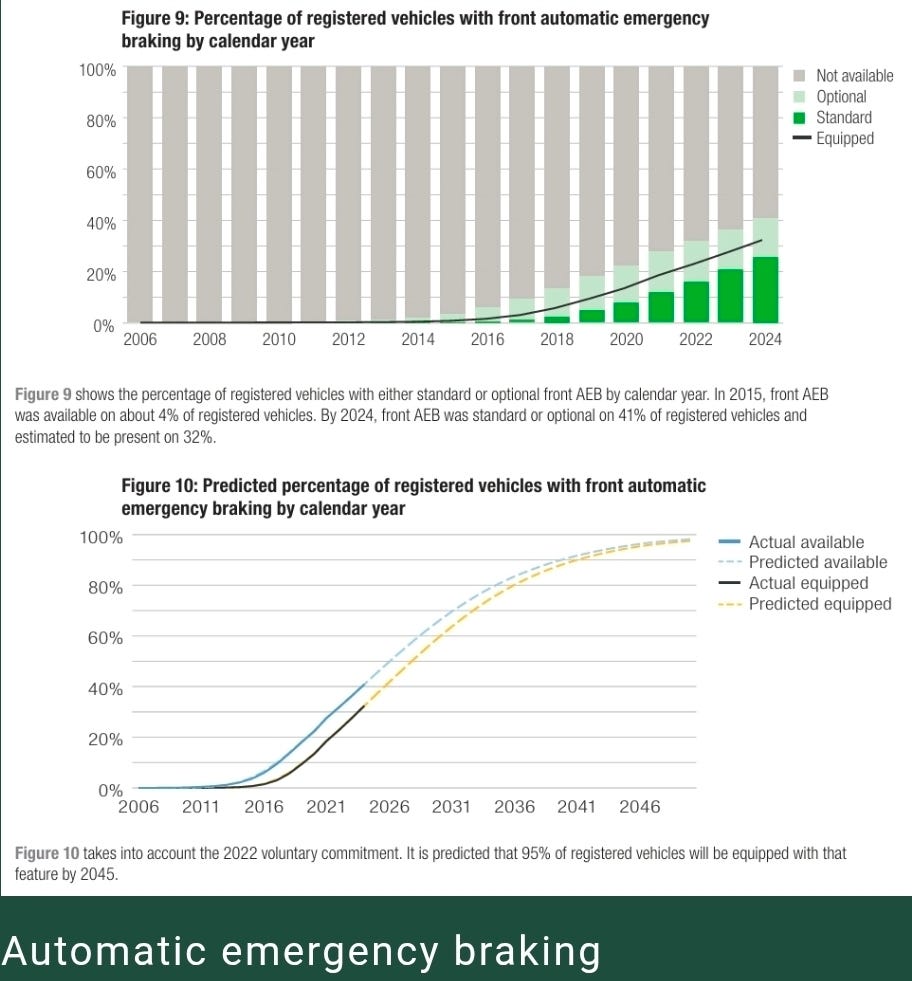
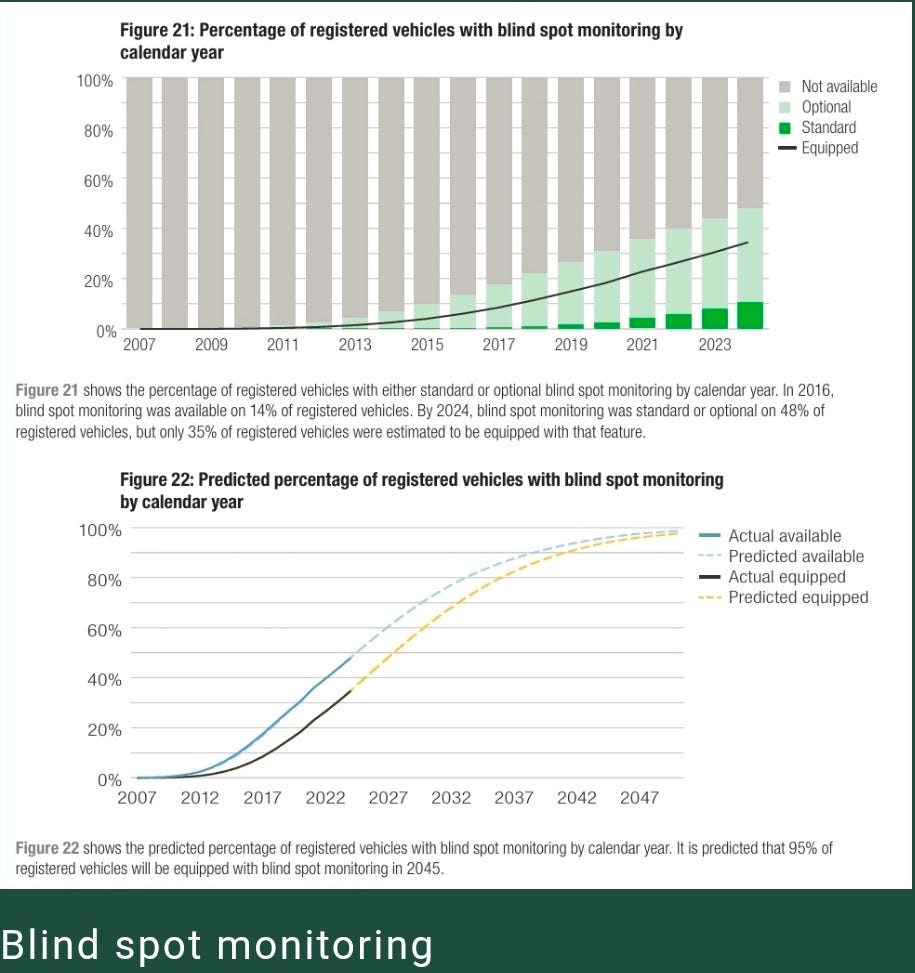
It takes many years for new vehicle features to spread through the registered vehicle fleet, even when they are required by the government. Among the collision avoidance features, only rear cameras have been mandated.
With this in mind, will AV penetration pose an existential risk to CPRT business?
Given that AV tech is much more complex, we don’t deem it a risk.
First, we need to know the definition of “autonomy”:
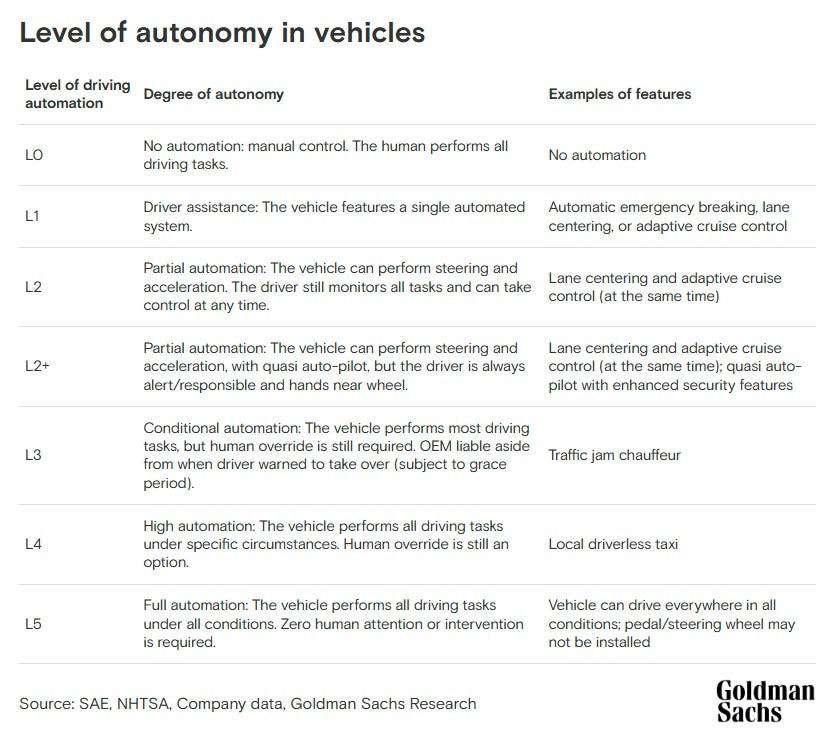
Goldman Sachs predicts that by 2030, up to 10% of global new car sales could be Level 3 vehicles: self-driving cars that let drivers take their eyes off the road and their hands off the wheel in some situations (eg. highway in clear weather).
Suppose this is correct and historic trends are indicative, it would be around year 2050 when all new vehicles sold are Level 3 autonomous. To fully penetrate all vehicles, it probably takes another 30 years. And this is only Level 3, not even Level 4/5!
Cash flows so far into the future when discounted back to present are negligible. Actually, we are more concerned of near term recession effects that would cause unafforability in insurance premiums.
Conclusion
We won’t do any valuation update since we have explained at length why the stock is cheap relative to fundamentals.
Everytime the stock price falls, it excites us. We will continue reallocating into CPRT at below $40b market cap.