
CPRT: Copart (3)
Hurricane Helene & Milton
In late September of 2024, Hurricane Helene made landfall in Florida. Severe flooding struck the Tampa Bay area and eventually caused significant damage elsewhere in Florida, Georgia and North and South Carolina, including areas not accustomed to dealing with storms of this magnitude.
Then less than two weeks later, Hurricane Milton struck Florida again. The back to back nature of the storms added a level of complexity to CPRT’s response that they had not previously experienced.
In comparison to Hurricane Ian, a similarly scaled and located storm from two years ago. CPRT’s execution this time round yielded better results with approximately twice as many vehicles picked up in the first 10 days of these 2024 storms in comparison to Ian in 2022.
CPRT’s emphasis is on retrieving, processing and selling vehicles as quickly as they can to help restore the communities in which they do business, and to assist the major insurance companies in resolving their claims with policyholders as quickly as they can.
By the end of October, just three weeks after Hurricane Milton, CPRT had sold 25% of all of the assigned vehicles they would ultimately receive from both Helene and Milton.
75% of catastrophic units sold in Florida during the month of October were sold on CPRT’s auction platform, a reflection on both presence as well as the speed of execution.
Important Value Drivers
Population Growth
Since 1960, population in the US has grown at 1% CAGR, which sounds like a fairly modest growth rate. But over a time horizon of that scale, population has almost doubled.
Vehicle Miles Driven
Over the same time period, vehicle miles driven has grown at 2%. As a result, vehicle miles travelled has quadrupled since 1960, which is to say that ultimately, vehicle miles travelled grows faster than population alone, as the US grows more populous and more prosperous.
Accident Rates Downward Trend
Over the past 30 years, the Department of Transportation has published data on police reported crashes. There is one anomalous trend from 2014 to 2018. It is likely due to the proliferation of smartphones that caused accident rates actually to increase during that period.
Nevertheless, over the 30 years, we have seen a steady decline in accidents per miles driven. In fact, today versus 1990, there are about 33% fewer crashes and fatalities per million miles driven.
But in absolute terms, that decline has only been 8% because of the offsetting effects of the growth in population and vehicle miles travel.
Safety technologies penetrate gradually into new vehicles and into the installed base of existing ones. It is the fleet effect that causes the gradual decline in accidents relative to the perhaps more innovative technologies today.
Total Loss Frequency Upward Trend
This has been the key catalyst in CPRT growth for decades and has more than quadrupled since 1990. This is a phenomenon that has exhibited a nearly monotonic increase over that period.
The long-term catalyst here is that vehicles are becoming ever more complex and therefore more expensive to repair, causing the repair path to be less attractive, while also the intrinsic value of these vehicles has risen.
The proliferation of safety technologies that drive accident frequency down are not lowering total loss frequency. On the contrary, these technologies tend to be enabled by sensors and chips often configured on the perimeter of vehicles, rendering them quickly and easily damaged in an accident and raising the cost of repair.
These cars are actually still quite valuable to other markets. For example, for buyers in places like Eastern Europe, Central/South America, and Africa, where mobility needs are satisfied by salvaged cars.
Insurers and Accidents
So what problem does CPRT solve?
When an accident or a natural disaster happens to your car, the insurance company will either:
(a) pay for the cost of repairs, or
(b) pay you the value of the car, then take possession of it and sell the salvaged car.
When a vehicle is damaged, it is towed to a storage facility for inspection by an insurance adjuster. The adjuster estimates the repair costs and the vehicle’s Pre-Accident Value (PAV). If the repair costs exceed the difference of PAV and salvage value, the vehicle is classified as a total loss.
For example, if the PAV is $20,000, repair costs are $5,000, and the salvage value is estimated to be $17,000, the repair cost of $5,000 exceeds the difference of PAV and estimated salvage value of $3,000. The insurance company will classify the vehicle as a total loss. Then they will assign the vehicle to CPRT, pay the insured $20,000 and receive the vehicle’s title.
Otherwise, the insurance company will pay the repair cost if the value of the vehicle after the repair is still worth more than selling it in an auction.
This is where CPRT comes in to provide a marketplace that matches sellers (mainly insurers) with buyers of salvage vehicles.
Operationally, when the seller assigns a car for salvage, CPRT transports the vehicle to one of its nearest facilities. CPRT will pay advance charges to obtain the vehicle and will later recover these charges from the sellers when the car sells, either through an explicit recovery fee or by deducting from the sale proceeds.
CPRT doesn’t take inventory risk because the vehicles are on consignment. It simply earns a fee for the service of storing the vehicle and finding buyers for it.
Despite appearing like an industrial company, CPRT benefits from the two-sided network effect. This advantage results in winner takes all, producing high ROIC over many years. As we know, a high sustainable ROIC is the recipe for great compounding.
Due to the consignment model, CPRT requires minimal net working capital, and as expected, most of its capital investment is in land, reflected in property, plant & equipment (PPE).
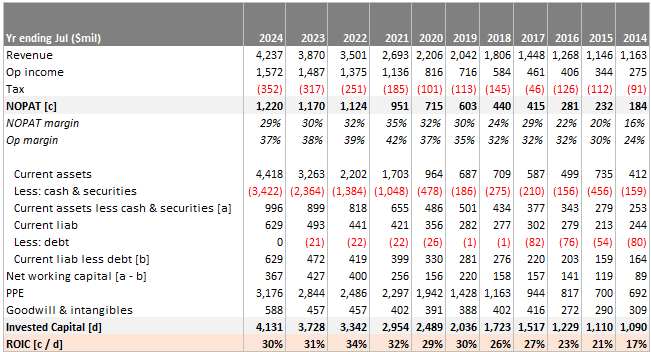
ROIC in 2014 was 17%, and grew steadily to 30% in 2024.
NOPAT margins increased from 16% to 29% over the same decade.
CPRT also operates with almost zero debt despite the predictability of earnings. Management has always operated with an owner mindset, and this conservatism shows on the balance sheet.
Industry Structure
CPRT sits between the sellers of cars, most of which are auto insurance companies, and the buyers. The seller side is concentrated, with the top three players accounting for 45% of the auto premiums written.
The buyer side is more fragmented, consisting of smaller entities such as vehicle dismantlers, rebuilders, repair licensees, used vehicle dealers, exporters, and the general public. These buyers have different motives, some want to sell the valuable parts and scrap the rest, while others buy and repair the vehicles to drivable standards in their countries, which are typically lower than in the US.
Sellers typically auction the vehicles on a consignment basis for a fixed fee or a percentage of the sales price. The fee primarily depends on the value of the vehicle being sold and can vary from $300 to $400 for a $2,000 car to as high as 4-7% of the final price for vehicles worth over $10,000. CPRT takes a cut from both buyers and sellers of the vehicle; buyers typically contribute around 70% of the total fees, while the rest is contributed by sellers. This mix is likely due to the lower bargaining power of buyers compared to the insurance carriers, who drive a significant portion of the inventory volumes.
Cornered Resource
Despite selling all of their cars online, salvage yards need physical land to house cars. The resource that new entrants find hard to obtain is land. Starting a salvage yard involves dealing with toxic materials and chemicals, leading to resistance from local governments and residents.
In states like California, where even getting a new permit to build housing is challenging, forget about buying land and getting a permit to start a new salvage yard. Of course, if the salvage yard is already operational, that’s a different story, which makes incumbents like CPRT the only player.
Without competition, CPRT has been strengthening its lead by acquiring more land, ensuring it can never be caught up. Competitors must spend capital to enter the market at the current market price of land, where lands have been appreciating. Alternatively, they can lease the land, but leasing is subject to the same inflation trend and doesn’t build equity in the land.
The car salvaging industry has been a duopoly for a long time, with the other major player, IAA leasing land instead of owning it. IAA was owned by private equity, and PE firms don’t have the long-term mindset to invest in land, which turned out to be the very strategic cornered resource that allowed CPRT to earn superior ROIC.
As a result, IAA had better near-term cash flow but was left in an inferior strategic position. The cost of leasing the land must have gone up over time for IAA and growth is an issue too because of the risk of not being able to continue the lease should local municipalities disallow the lease for salvage yard purposes.
Over time, this industry has consolidated to an 80% market share by the duopoly, with IAA ultimately being bought by Richie Bros. Furthermore, the auto insurers are also consolidated, making it hard for new entrants to scale quickly.
Network Effect
In any two-sided marketplace, critical mass is key and inherently creates a flywheel effect. Buyers seek the largest inventory to find what they need, while sellers want the most buyers to maximize their sales prices. As more sellers join, more buyers are attracted to the marketplace, which in turn attracts even more sellers, creating a positive feedback loop.
By owning the most land and thus having the most salvage yards, CPRT can sell the most cars, which is valuable to sellers. This creates a critical mass that is hard to dislodge.
Sales of US vehicles to CPRT members registered outside the state where the vehicle was located accounted for 66% of total vehicles sold. Of these, 32% were sold to out-of-state members within the US, and 34% were sold to international members. This global network effect enhances the marketplace’s value by attracting a diverse and extensive range of buyers and sellers.
CPRT has a global network which is difficult to displace. This is superior to localized networks like Uber and DoorDash, where the number of restaurants or drivers in one place is irrelevant to another place, or radial networks like Western Union, where transactions occur only between specific points.
Economies of Scale and Switching Costs
The business involves significant fixed costs, and the company with the largest revenue base can spread these costs more efficiently. Competing with CPRT requires a big investment to replicate its extensive physical footprint.
Sellers and insurance companies have established technical integrations with CPRT and IAA, creating some switching costs for new entrants. Convincing them to adopt a new system is a challenging task, especially when CPRT already has a deep database of quotations.
Although buyers and sellers often use multiple providers to achieve their goals (similar to how gig drivers operate on both Uber and Lyft, or short-term rental hosts list on both Airbnb and Vrbo), insurance companies are unlikely to integrate with a third player for just a marginal increase in visibility of their car inventories due to the operational hassle required.
Valuation
What is the implied PE multiple for a business that has ROIC of 30%?
Let’s do some investing math…
(1) g = IR * ROIC
(2) Distributable cash = (1 – IR) * E
where g = growth rate, IR = reinvestment rate, E = earnings
Intuitively, the company’s growth rate (g) depends on its rate of reinvestment (IR) and the returns it can generate on that investment (ROIC). Equation (1) tells us that high ROIC companies can achieve the same rate of growth as low ROIC companies with a lower reinvestment rate.
Similarly, the earnings a company has leftover to distribute to its owners depends on this rate of reinvestment. Equation (2) tells us that if both companies produce similar earnings (E), then the high ROIC company has more cash leftover for redistribution. This relationship is central to value creation.
Then we can proceed to derive the implied PE in terms of ROIC:
(3) P = D / (r – g) , where r = required rate of return, D = distributable cash
(4) P = (1 – IR) * E / (r – g) … from (2)
(5) P/E = (1 – IR) / (r – g)
(6) P/E = [(1 – (g / ROIC)] / (r – g) … substituting (1)
Rearranging, we get P/E = (ROIC – g) / [(r – g) * ROIC]
We make an assumption that r = 12.5% is our required rate of return that we demand for this investment. Then, back-solve for the growth rate that is implied under the current PE ratio of 44x.
The result is an implied growth rate of 11%.
In other words, if CPRT can sustain 30% ROIC and we demand 12.5% returns, it means that at current PE of 44x, CPRT implied growth is 11%.
We have an existing position at $50.3b market cap. Post earnings the shares jumped by +9.5%, we think the stock is not cheap enough to add.
Lastly, it’s noteworthy to know that in the past 3 fiscal years, CPRT has not done any share buybacks. During this period, the lowest share price was $27 in September 2022. The TTM PE ratio then was ~25x. Today, the PE expanded to 44x (+76%) while EPS grew from $1.13 to $1.40 (+24%). It is great that management is disciplined about reinvesting into the business, rather than repurchasing shares at expensive valuations.